
Monitoring a virtual machine is an essential part of maintaining a reliable application infrastructure. CPU usage, memory consumption, disk activity, network statistics, and individual process-level metrics can provide valuable information when troubleshooting performance or availability issues.
In this implementation, I configured Azure Monitor to collect process level data from an Azure Virtual Machine and send it to an Azure Log Analytics Workspace.
The implementation uses:
Azure Virtual Machine
Azure Monitor
Log Analytics Workspace
Azure Monitor Agent
Data Collection Rule (DCR)
Performance Counters
Azure Monitor Logs / KQL
The important part of this architecture is the Data Collection Rule. So instead of simply enabling monitoring on the VM Collection Rule defines which resources should be monitored which data should be collected. How frequently the data should be collected and where the collected data should be sent
1. Create a Log Analytics Workspace
The first step is to create a Log Analytics Workspace.
From the Azure Portal, search for:
Log Analytics workspaces
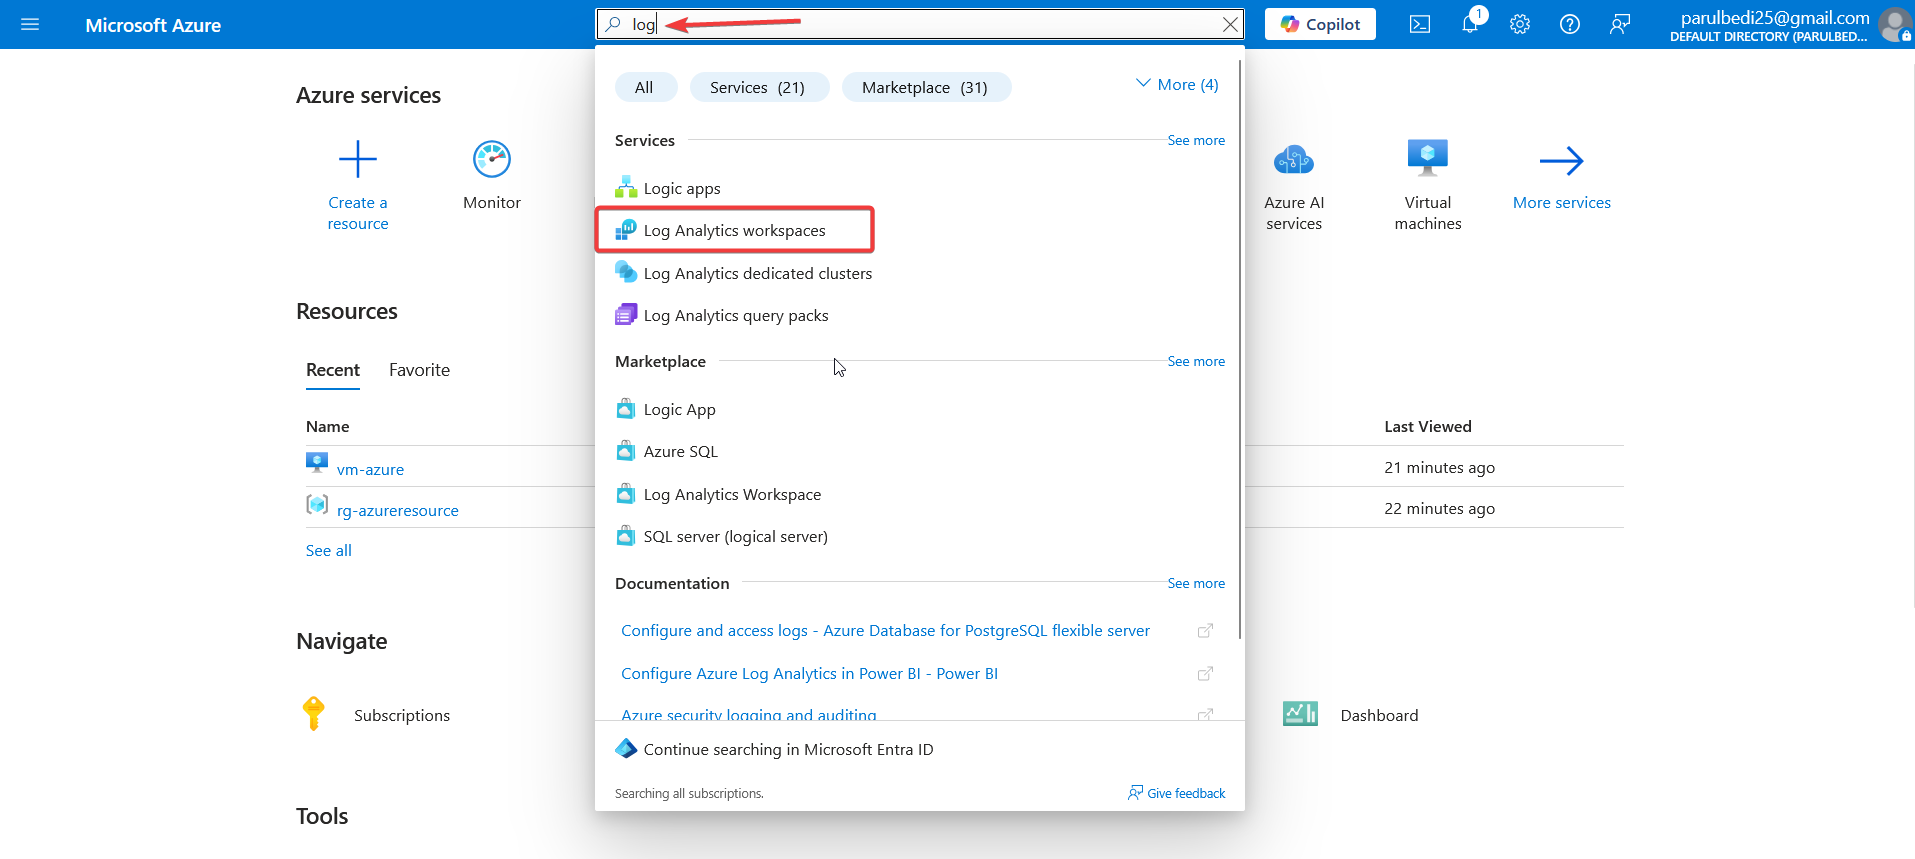
and select Create.
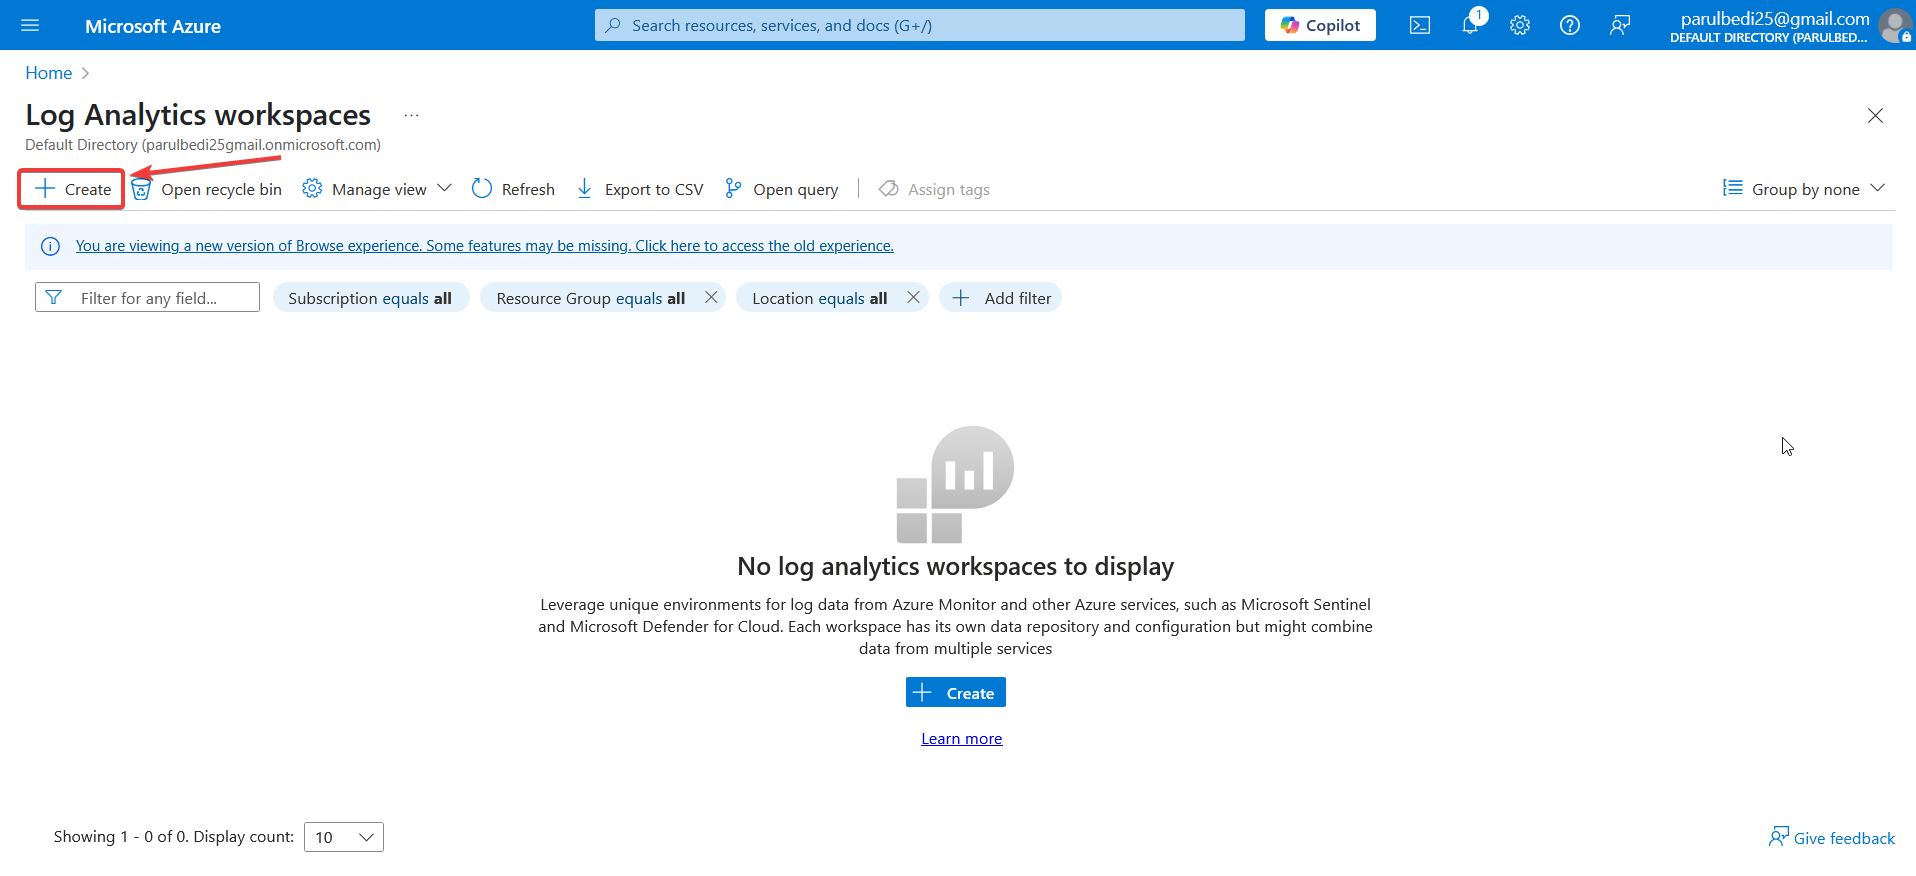
The Log Analytics Workspace acts as the central repository for monitoring the data collected from the VM
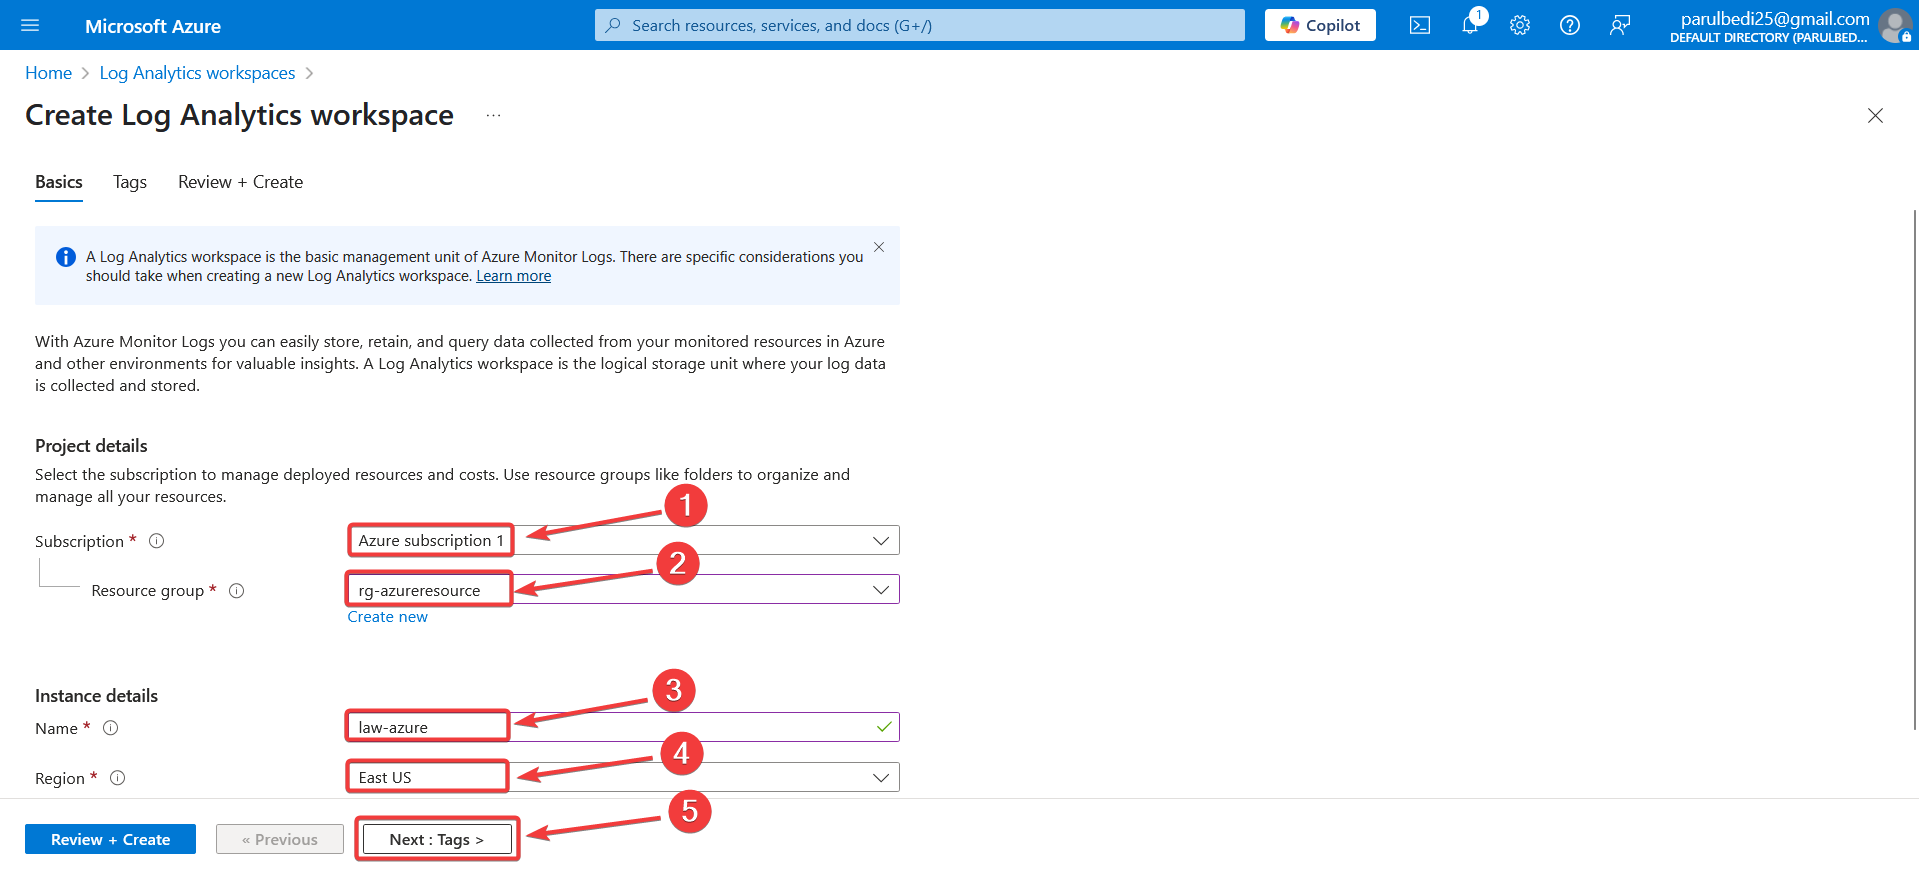
Configure the Workspace
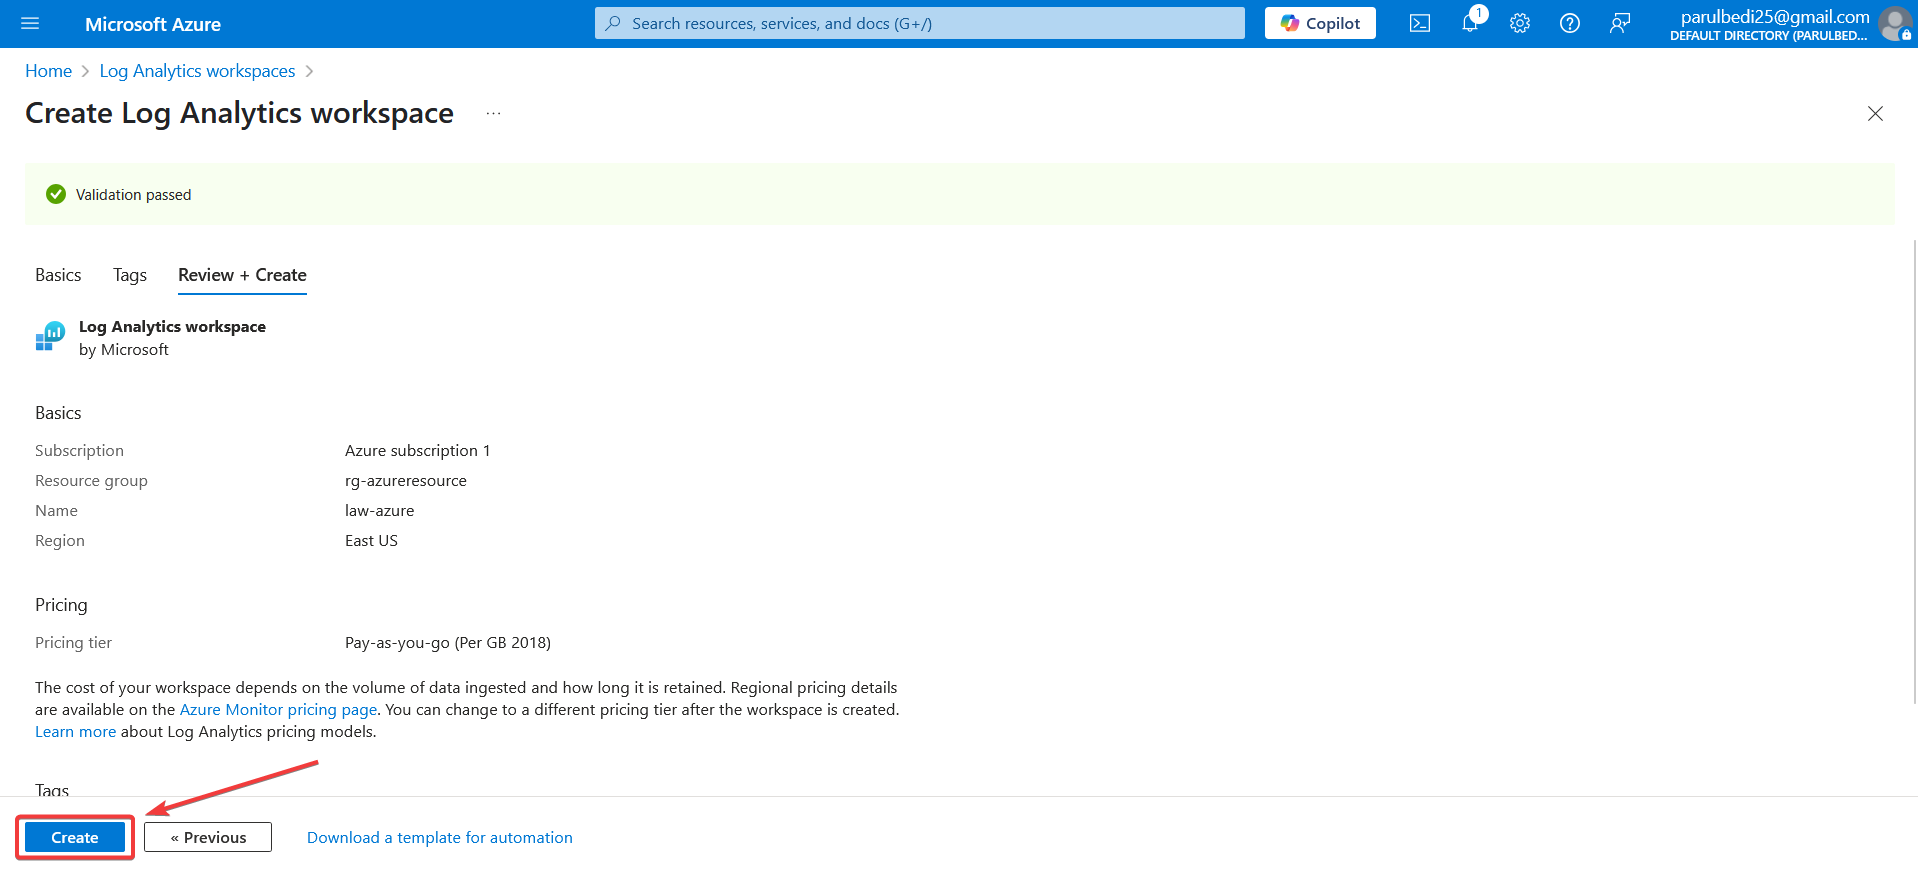
Under Basics, select the Azure subscription, resource group, workspace name, and region where the Log Analytics Workspace will be created. For this implementation, the workspace was configured in East US using the rg-azureresource resource group and named law-azure.
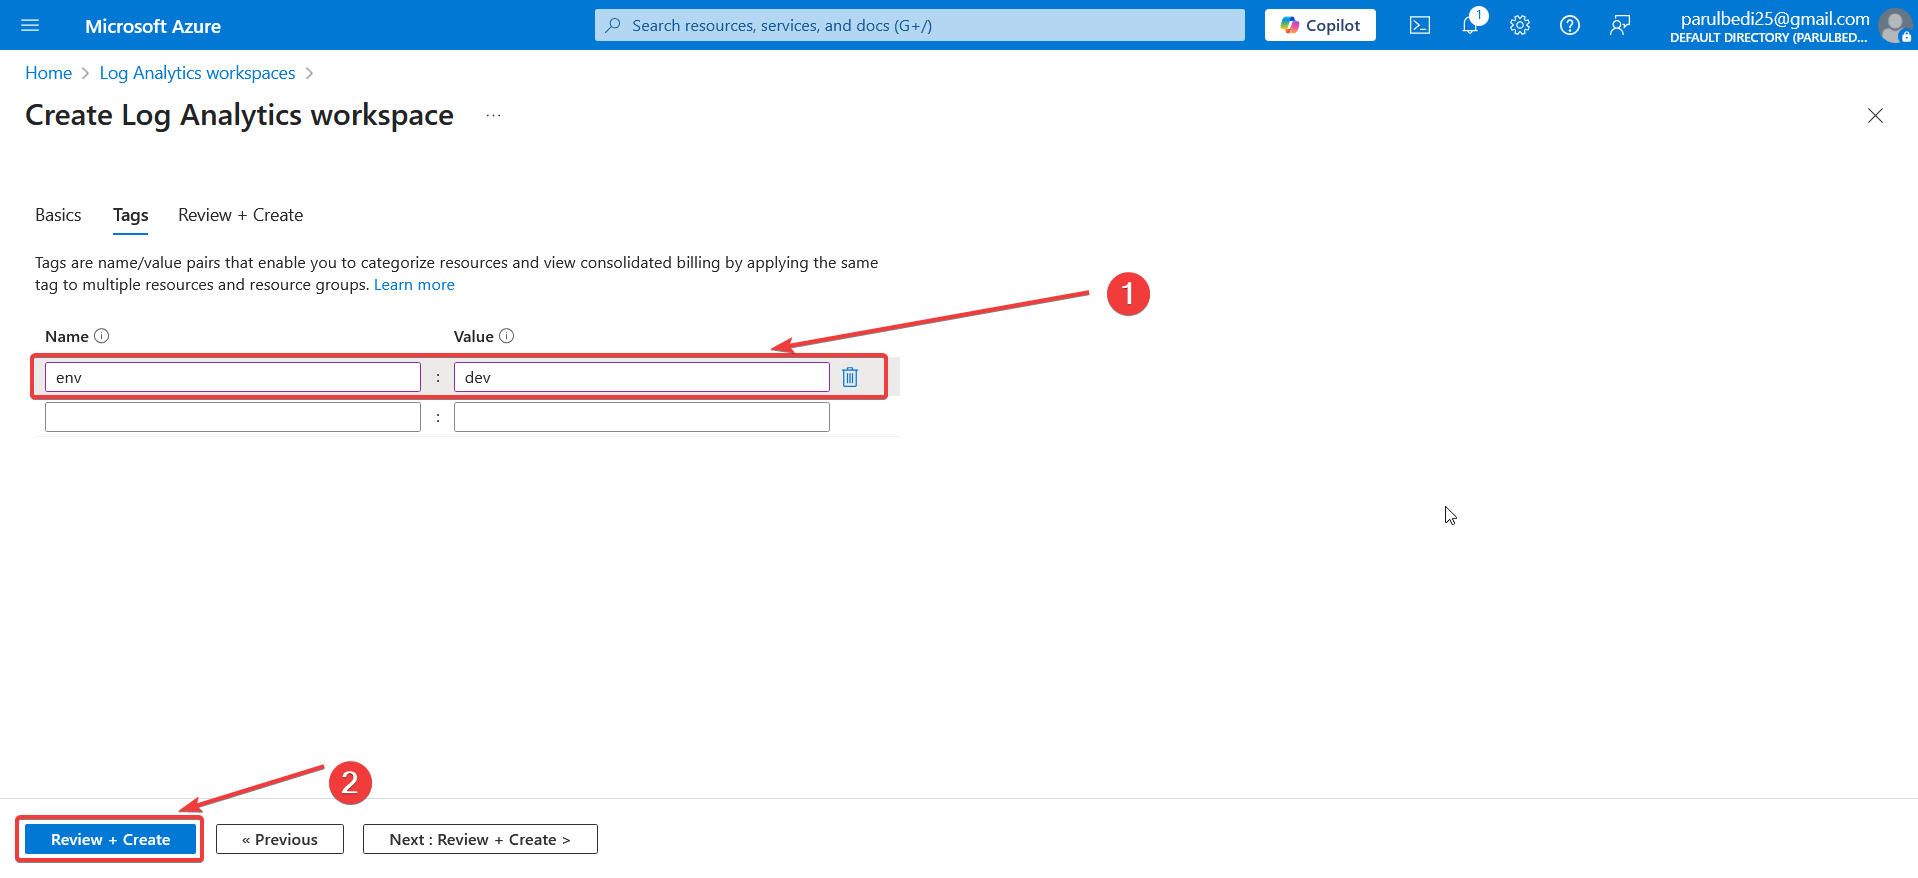
Tags are useful for organizing Azure resources and managing billing environments but it is optional in this case as this a POC
After reviewing the configuration validation check will pass, Click Create and the workspace will be created.
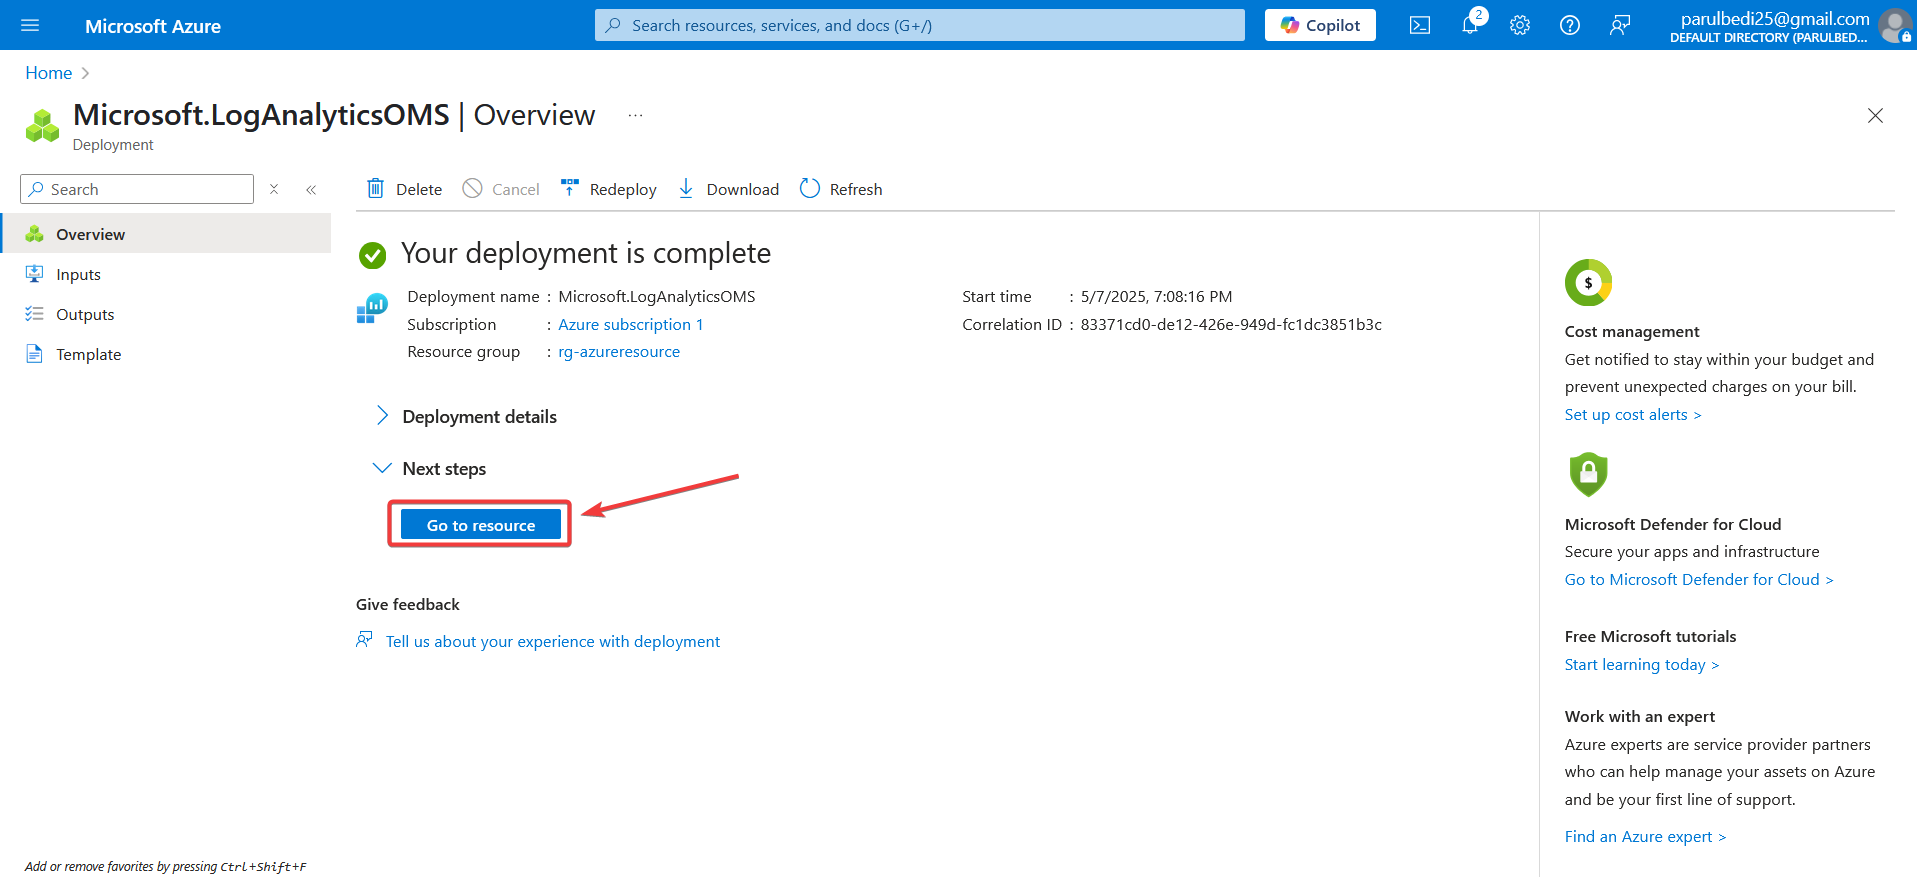
Once deployment finishes Azure displays the deployment status. Click on Go to resource. The newly created workspace can then be accessed from the Azure Portal.
2. Verify the Log Analytics Workspace
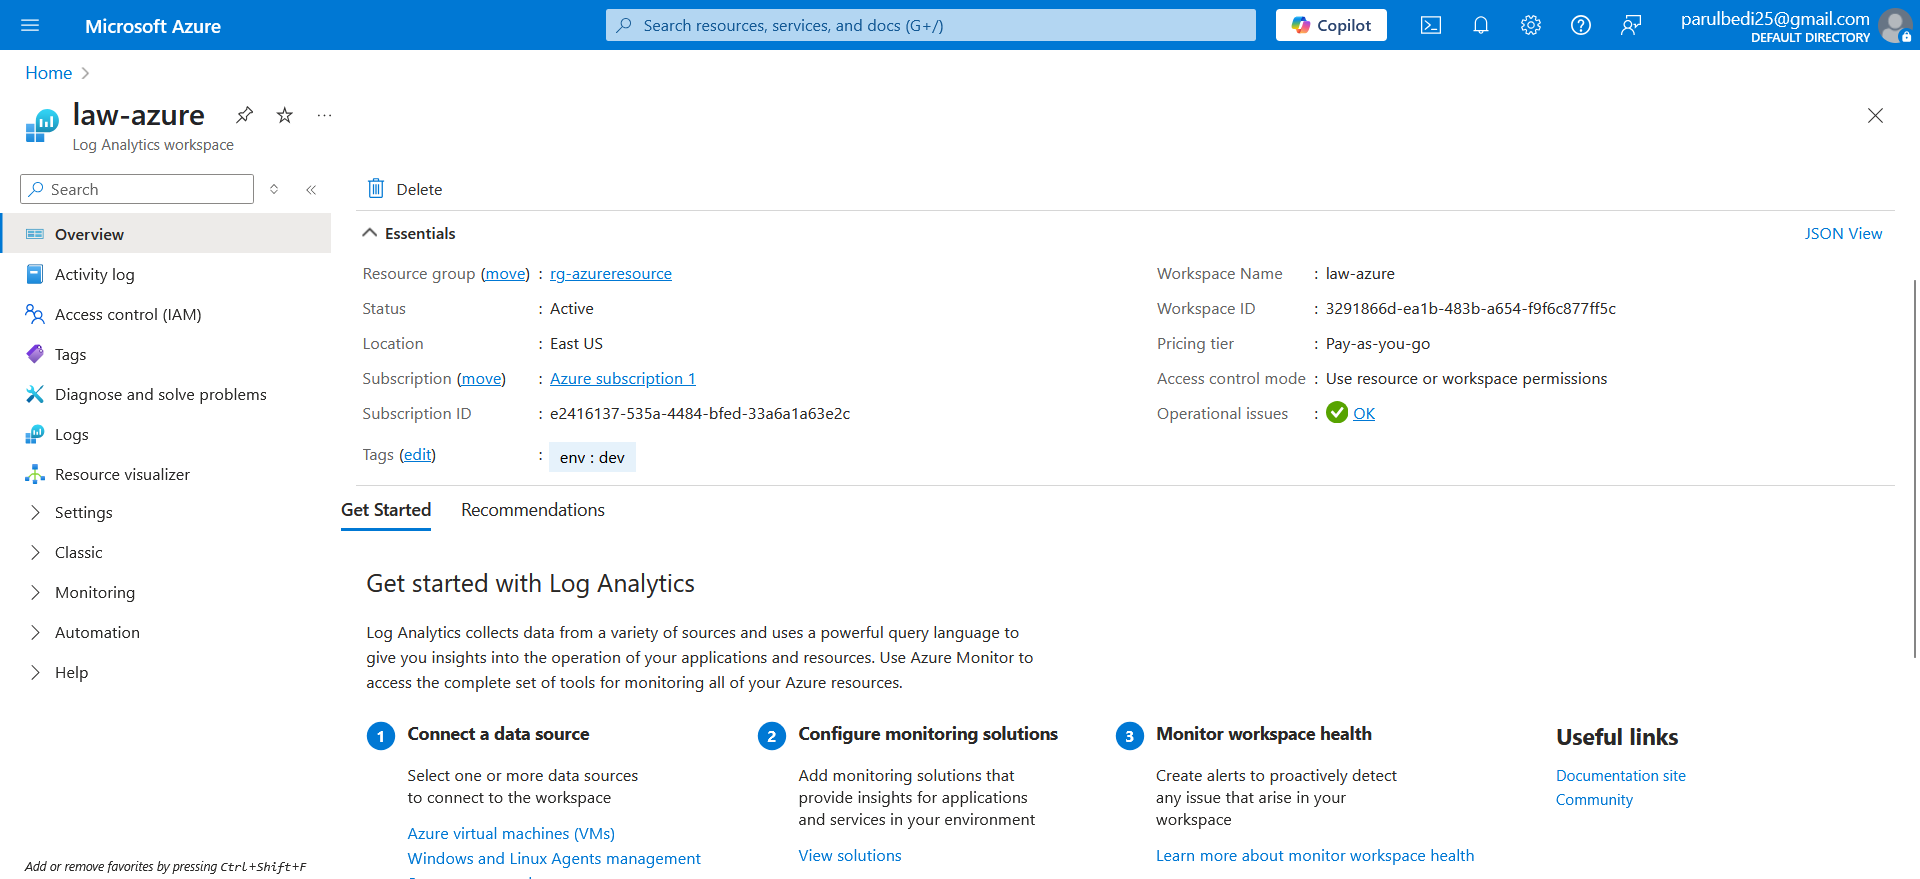
After opening law-azure, the workspace configuration can be verified, including its name, resource group, region, pricing tier, and active status. In this implementation, the workspace is configured in the East US region under the rg-azureresource resource group.
3. Create a Data Collection Rule
The workspace does not automatically collect process level data from an Azure Virtual Machine. To collect this data we need to configure a Data Collection Rule (DCR) in Azure Monitor
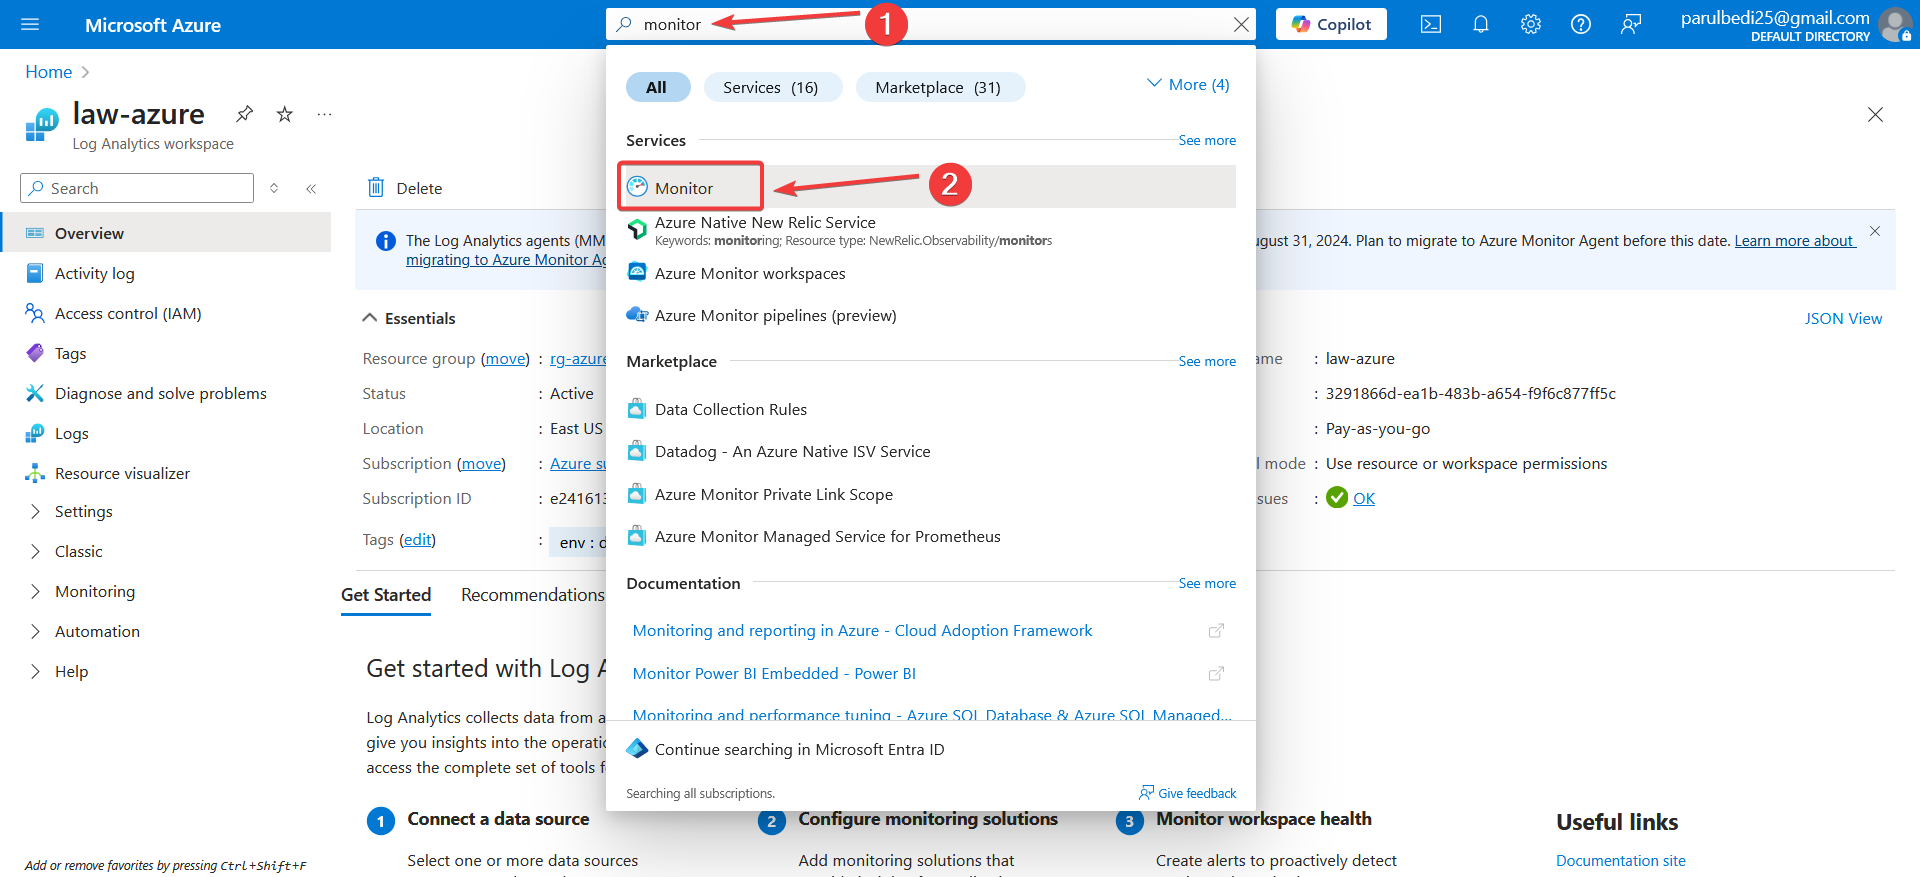
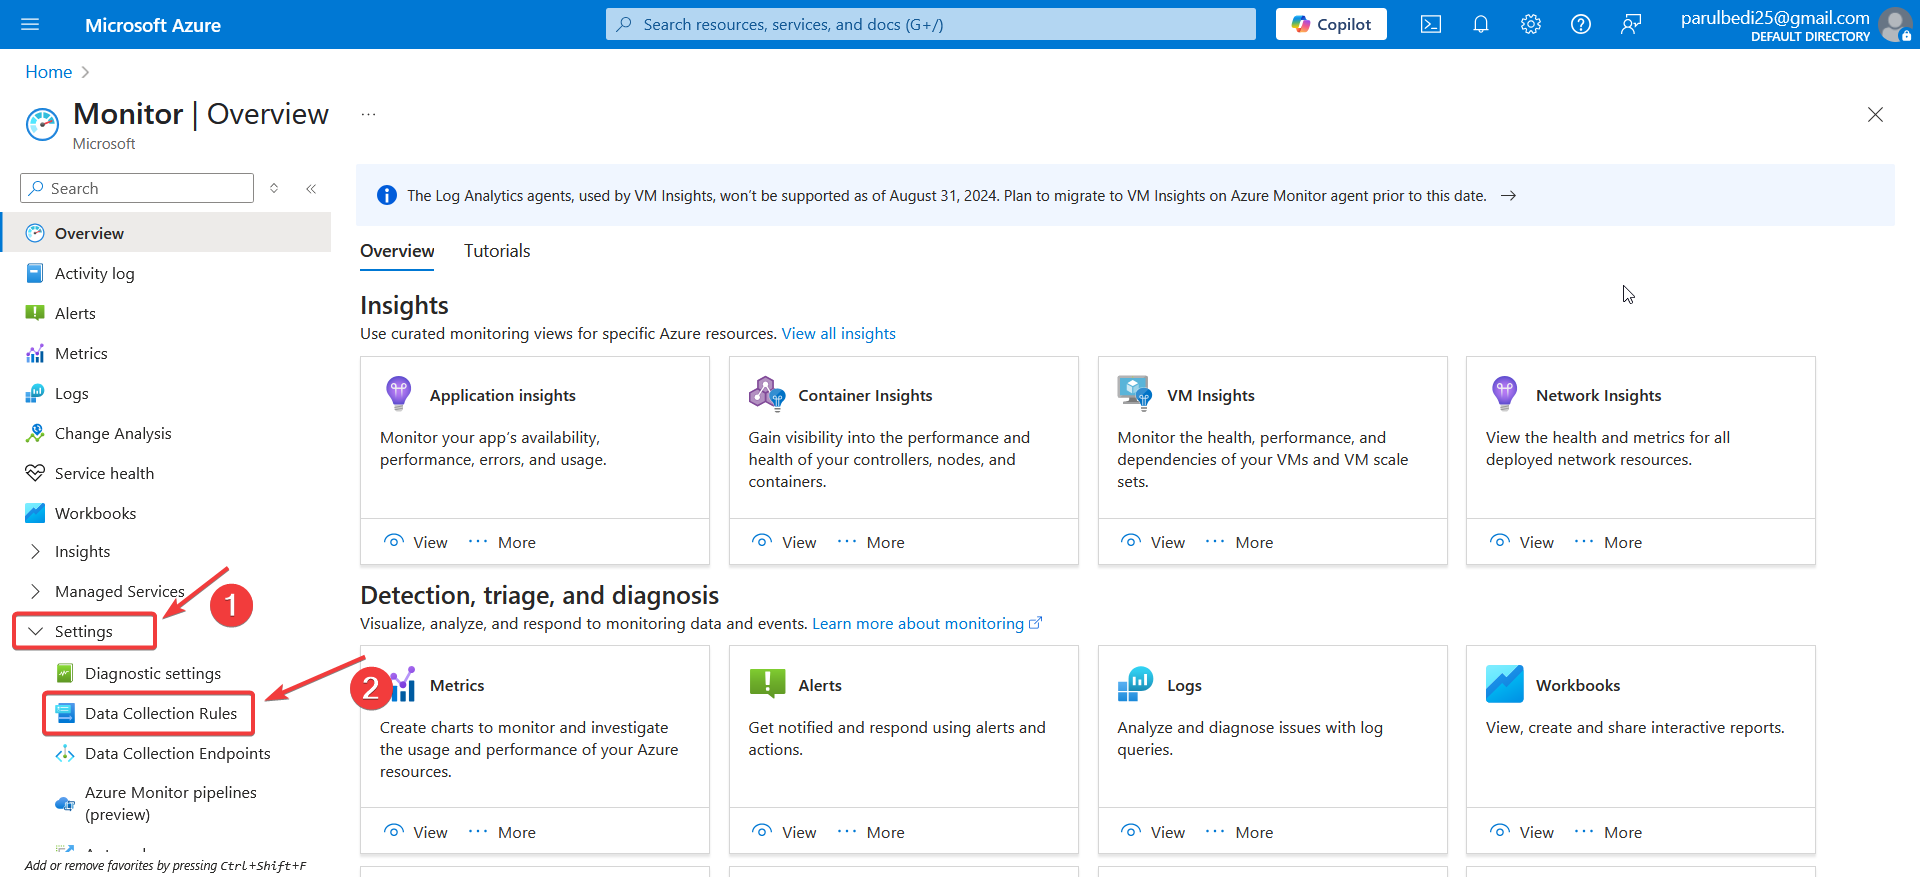
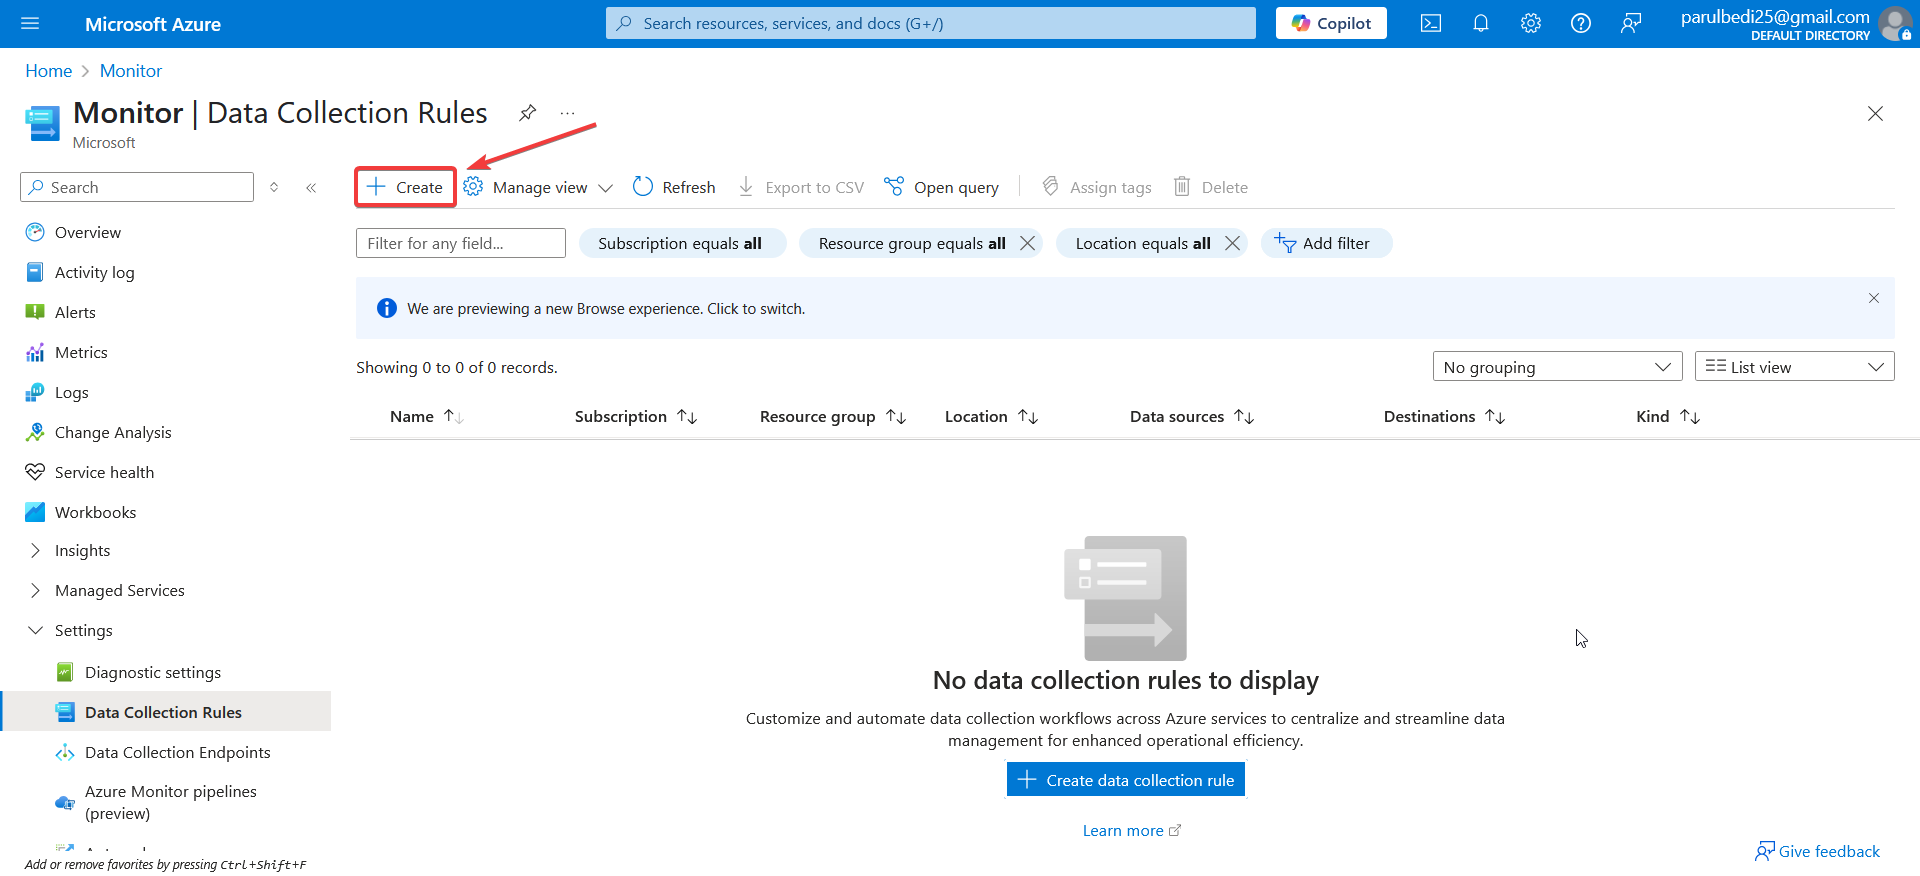
Navigate to Azure Monitor → Data Collection Rules and select Create to create a new data collection rule
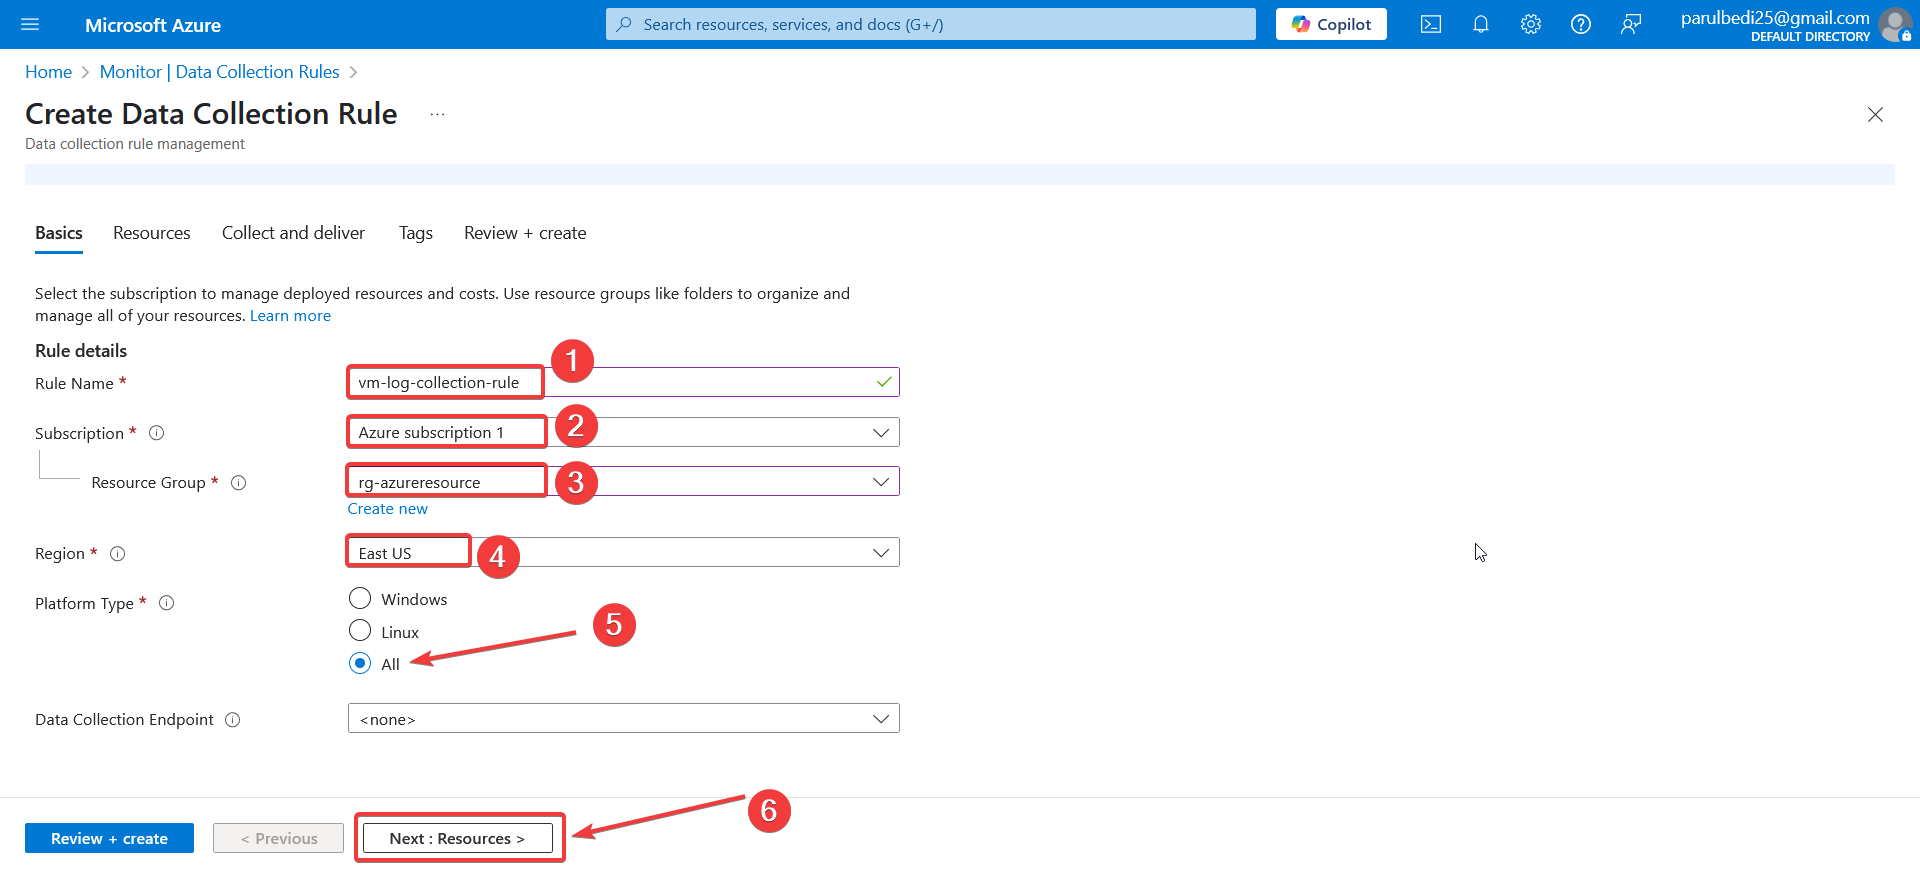
The rule is created with the name vm-log-collection-rule under rg-azureresource in East US with the platform set to All. Selecting All for the platform allows the rule to support the applicable Windows and Linux monitoring configuration rather than restricting it to a single operating system
4. Select the Virtual Machine
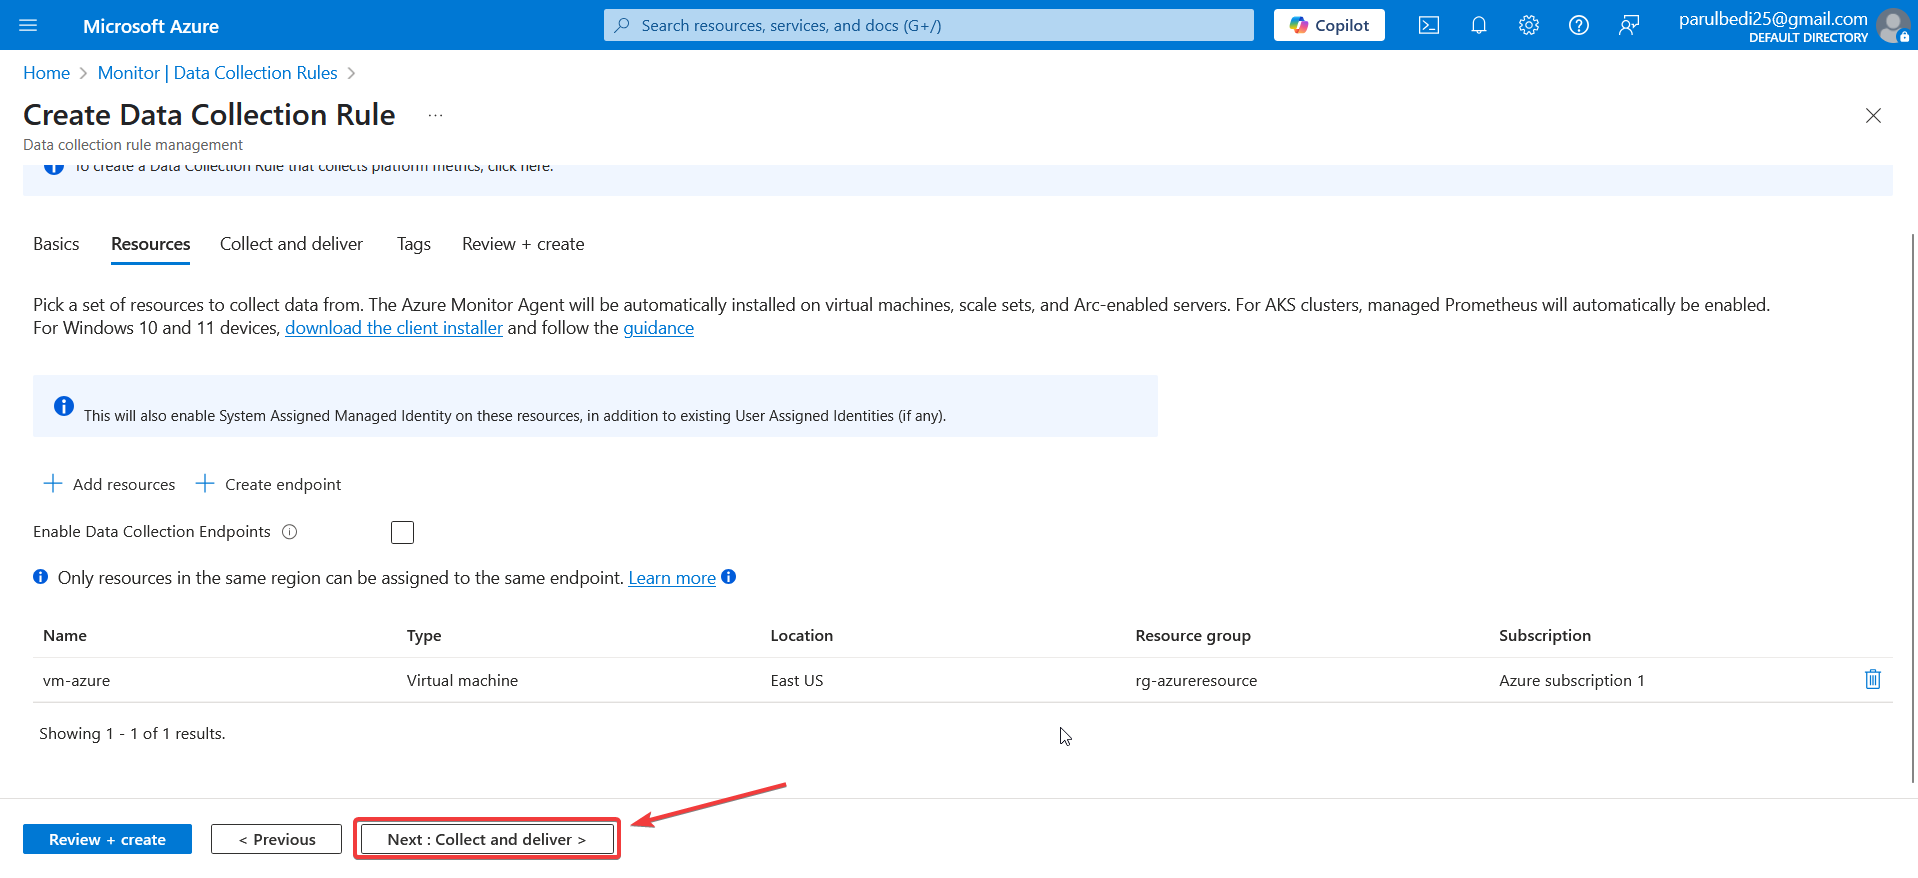
Next, the Data Collection Rule is associated with the VM that will provide monitoring data. Under Resources, select Add resources and choose the target VM: vm-azure
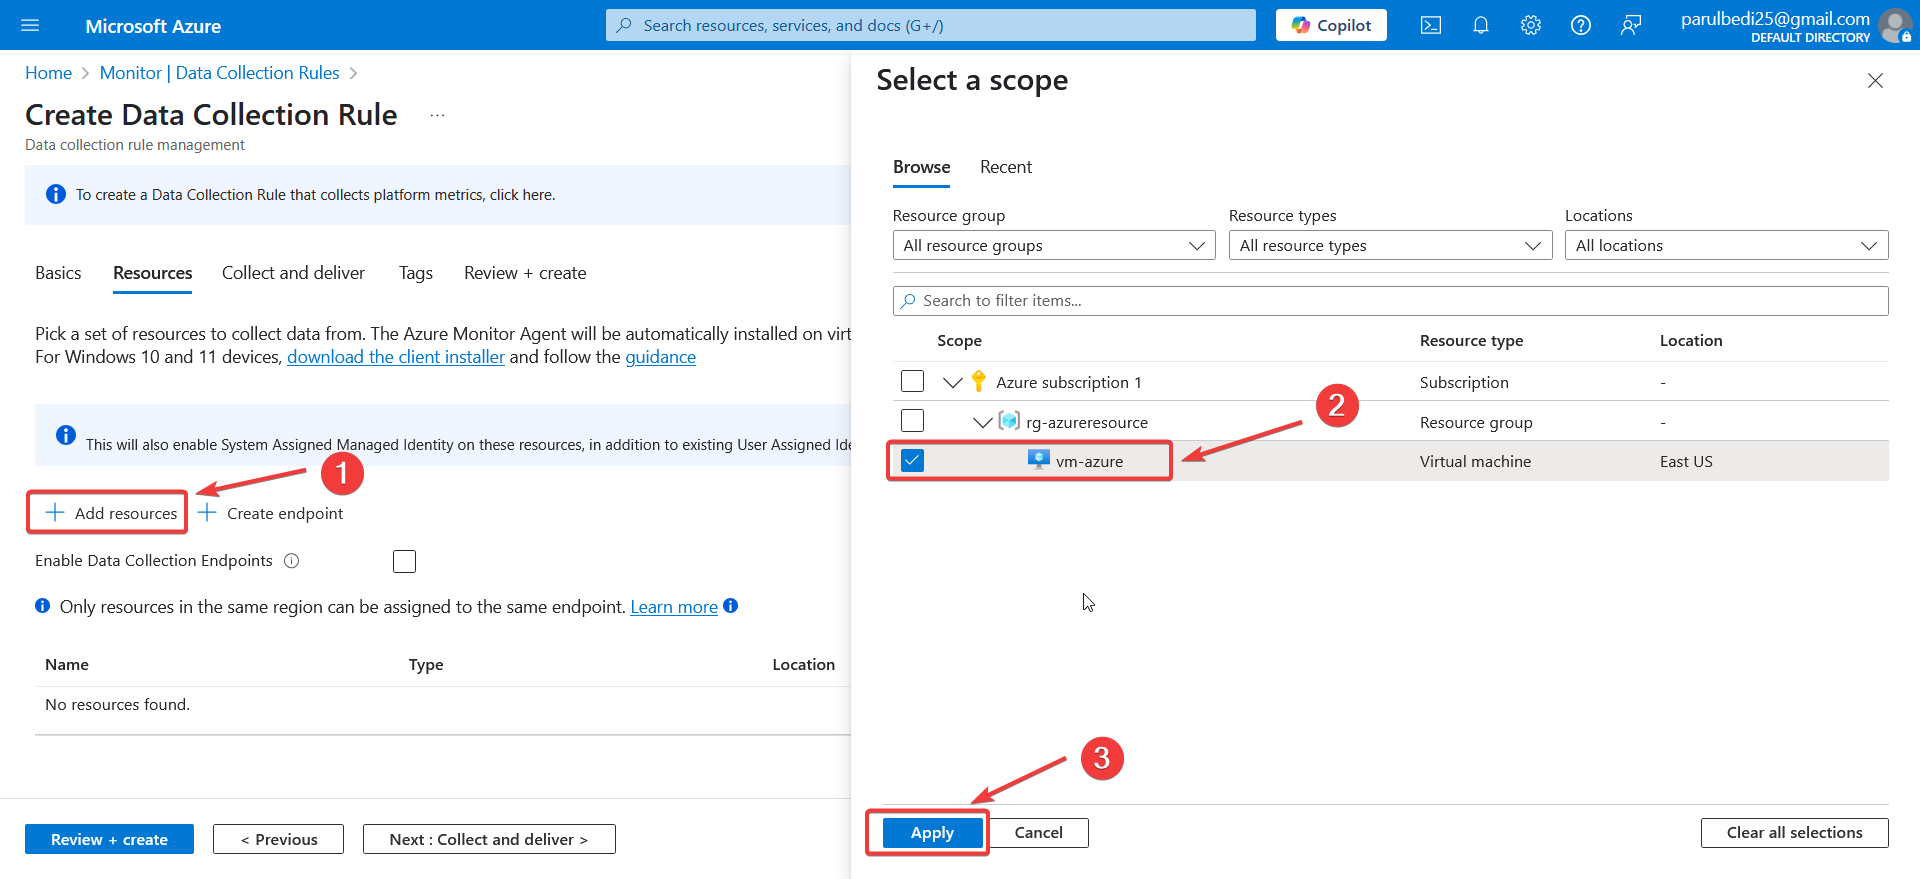
After selecting the VM it appears in the resource list. The DCR will now be associated with this VM
5. Configure the Data Source
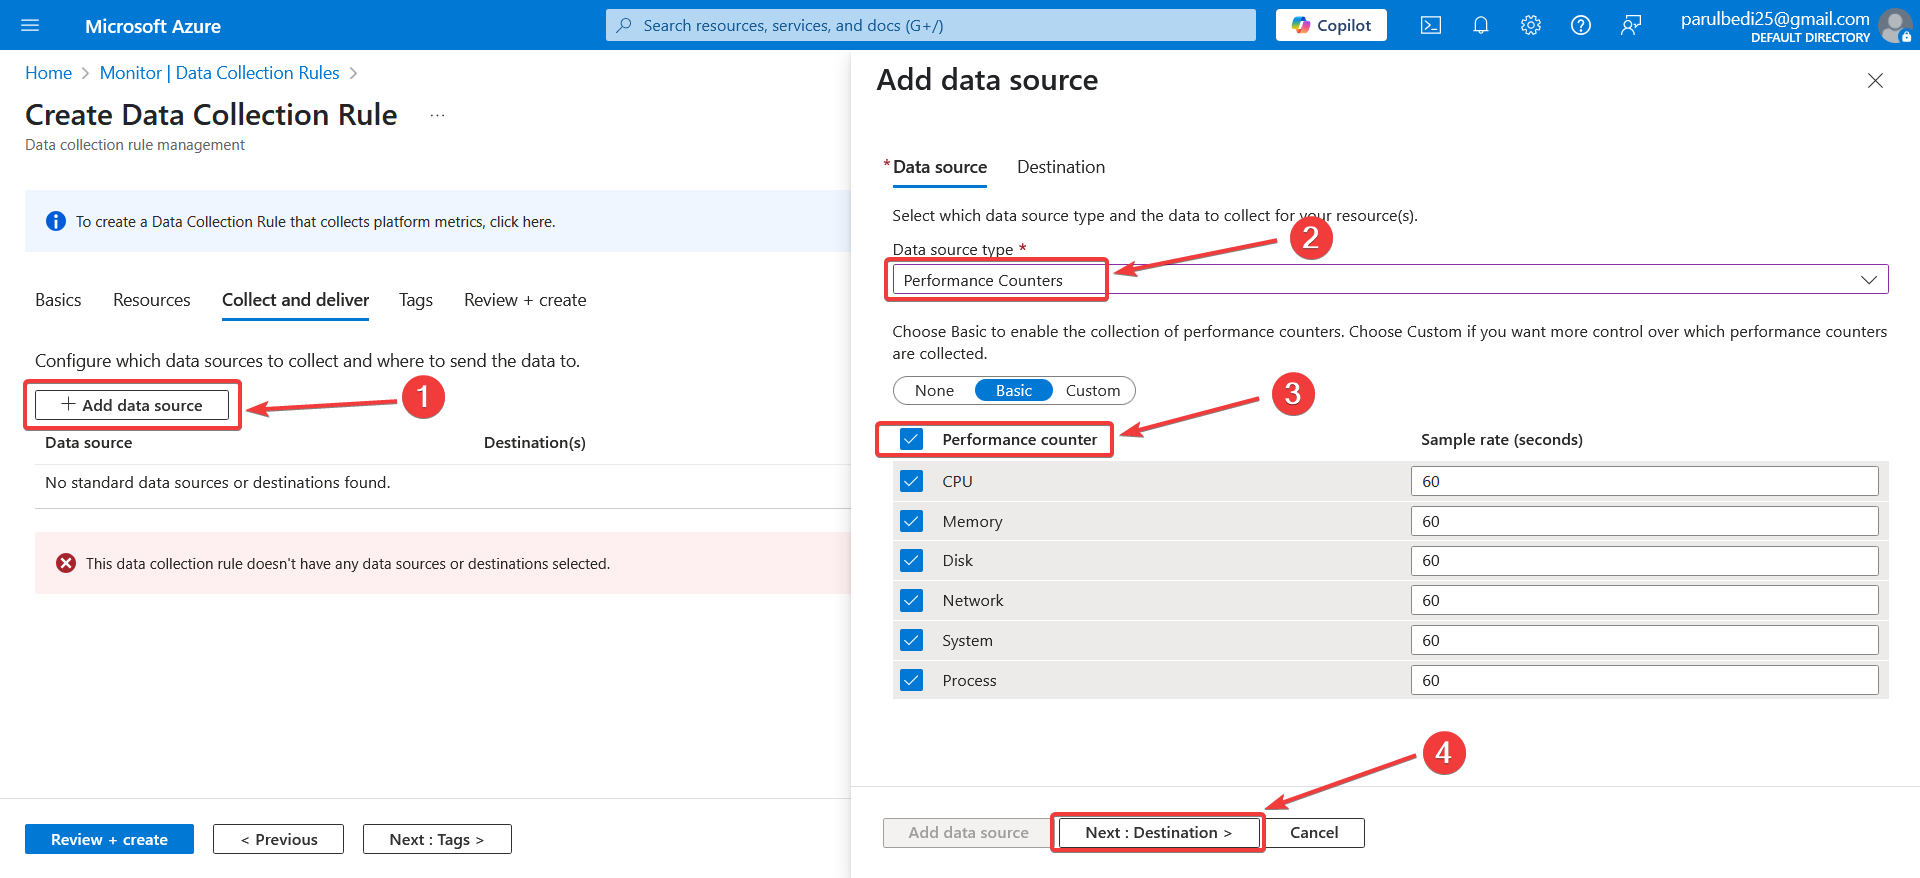
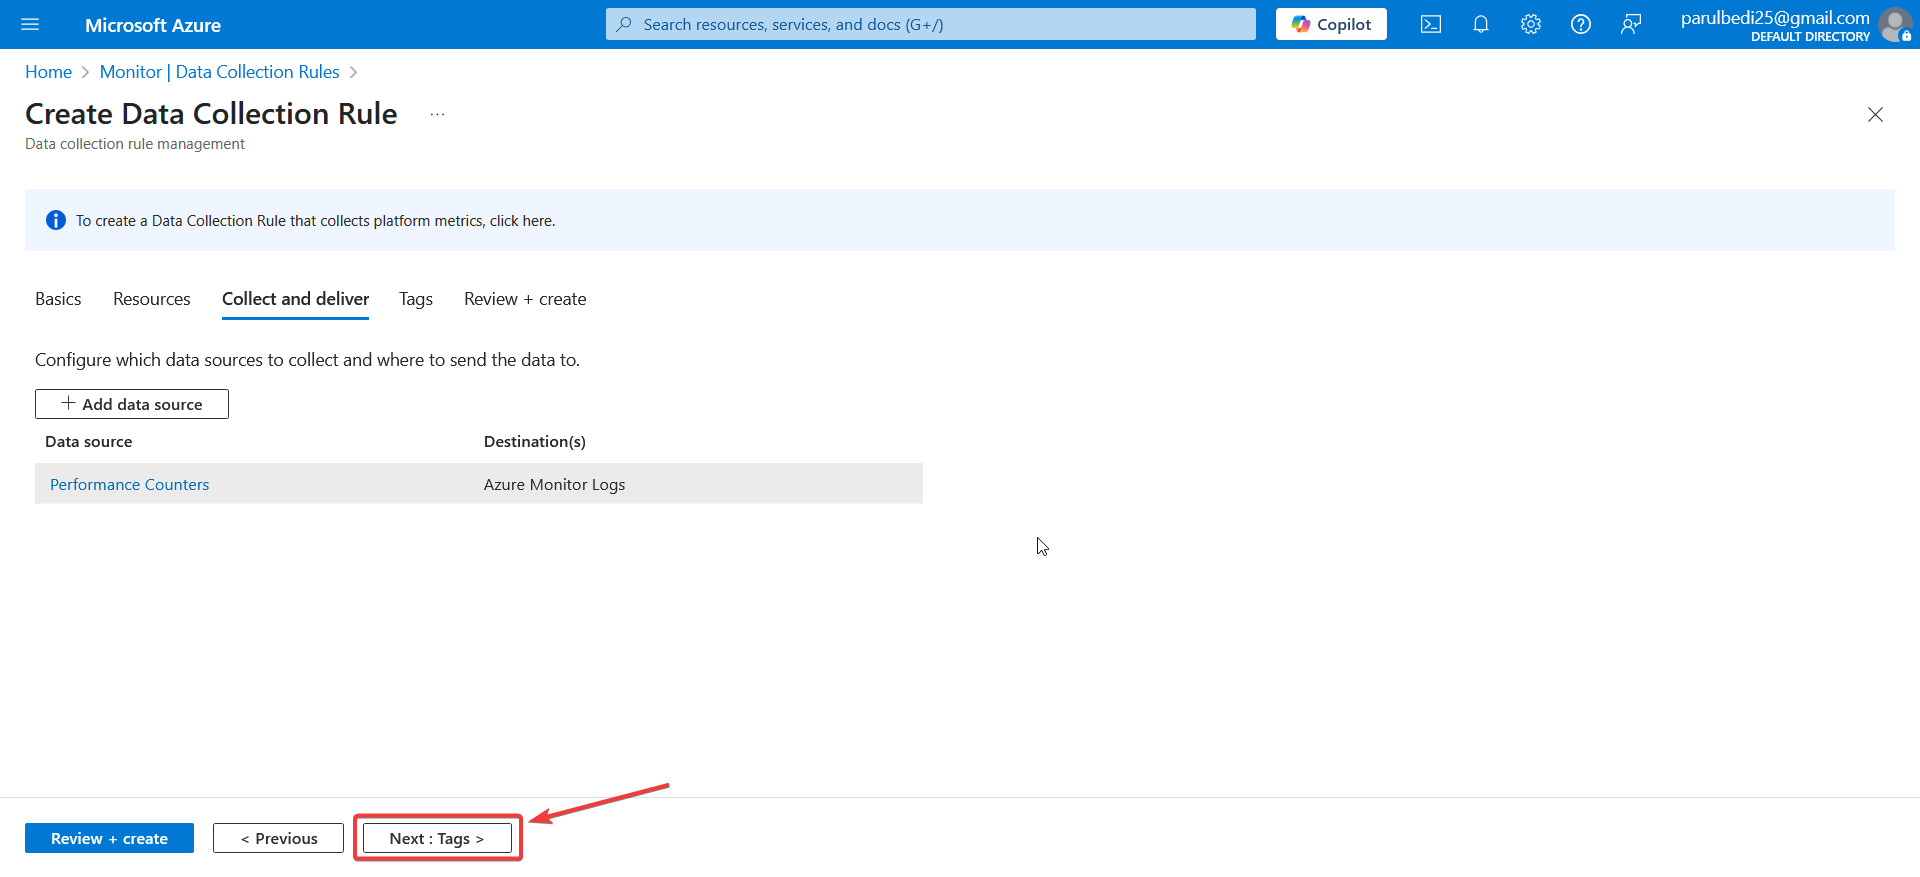
Data Collection Rule (DCR) defines the performance data to be collected from the monitored system. Under Collect and deliver → Add data source, select Performance Counters and configure counters for CPU, Memory, Disk, Network, System, and Process monitoring
6. Configure the Destination
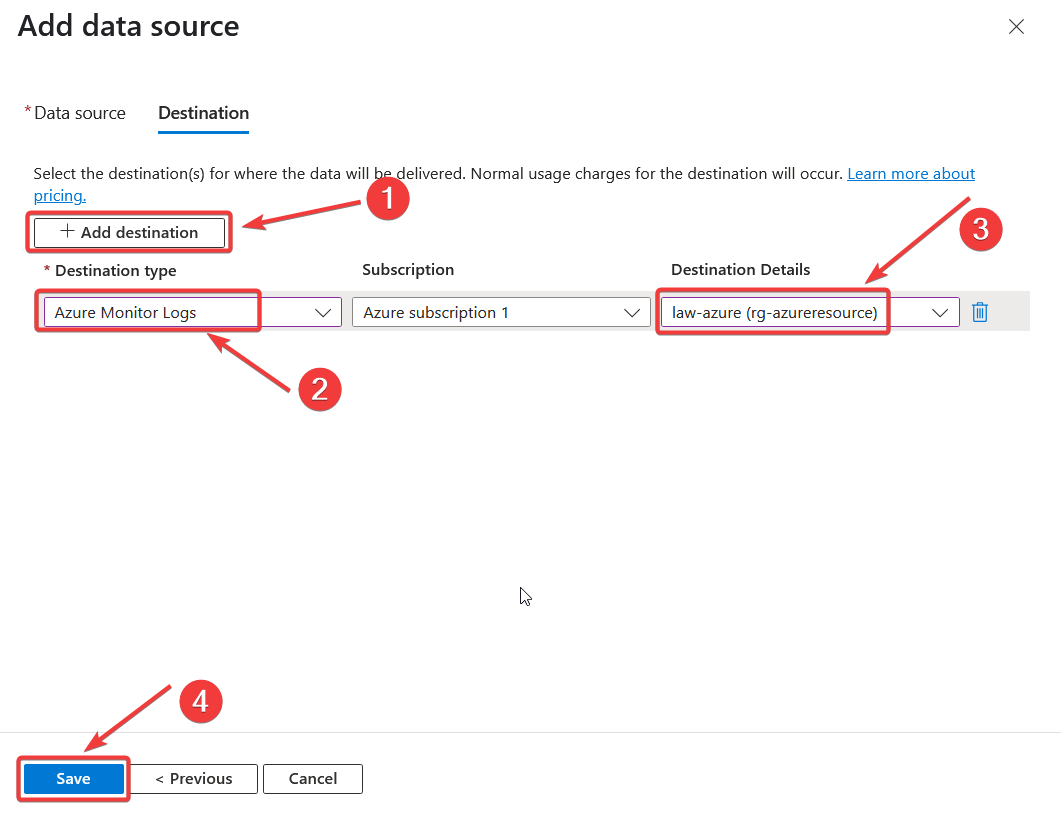
After selecting the required performance counters, we need to define where Azure Monitor should send the collected data. Click Add Destination to configure the destination. Under Destination Type, select Azure Monitor Logs, choose Azure subscription as the subscription, and select law-azure as the destination Log Analytics workspace. This configuration ensures that the collected performance counter data is sent to the selected Log Analytics workspace where it can later be queried and analyzed using Azure Monitor and Log Analytics.
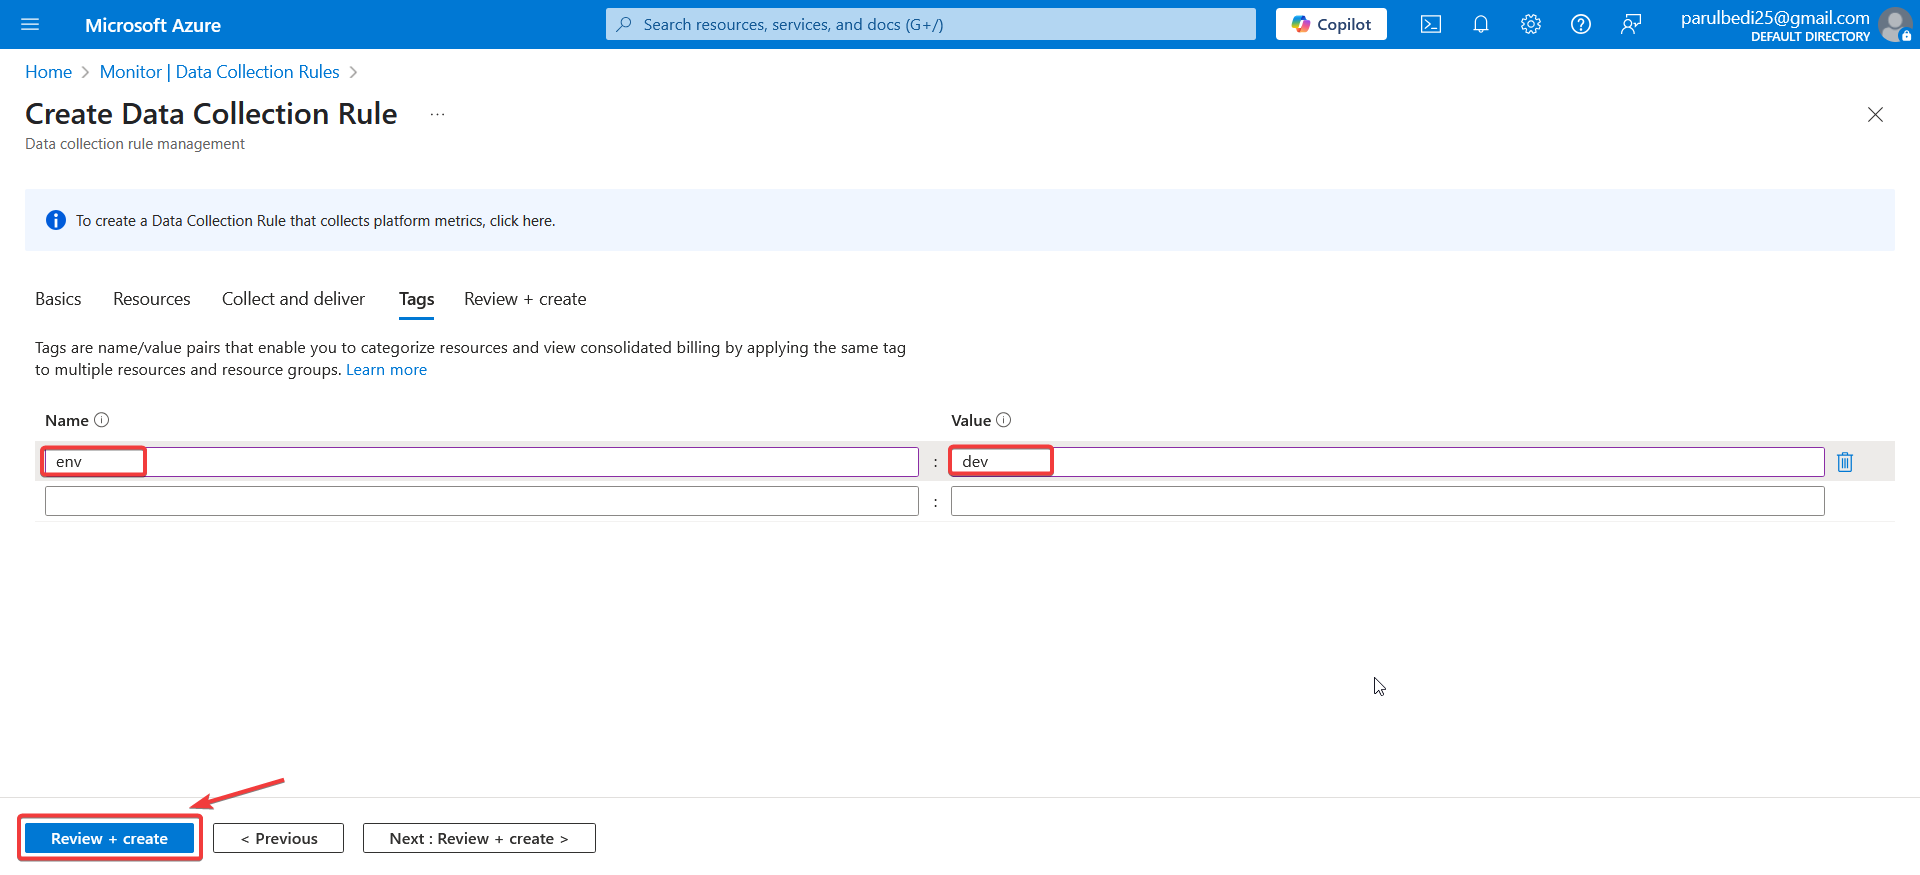
7. Add Tags to the Data Collection Rule
Similar to the Log Analytics Workspace, I also added the environment tag env = dev to clearly identify the resource as part of the development environment. Tags become particularly useful when an Azure environment contains multiple development, testing, staging and production resources
8. Review and Create the Data Collection Rule
Before deployment Azure provides a summary of the DCR configuration
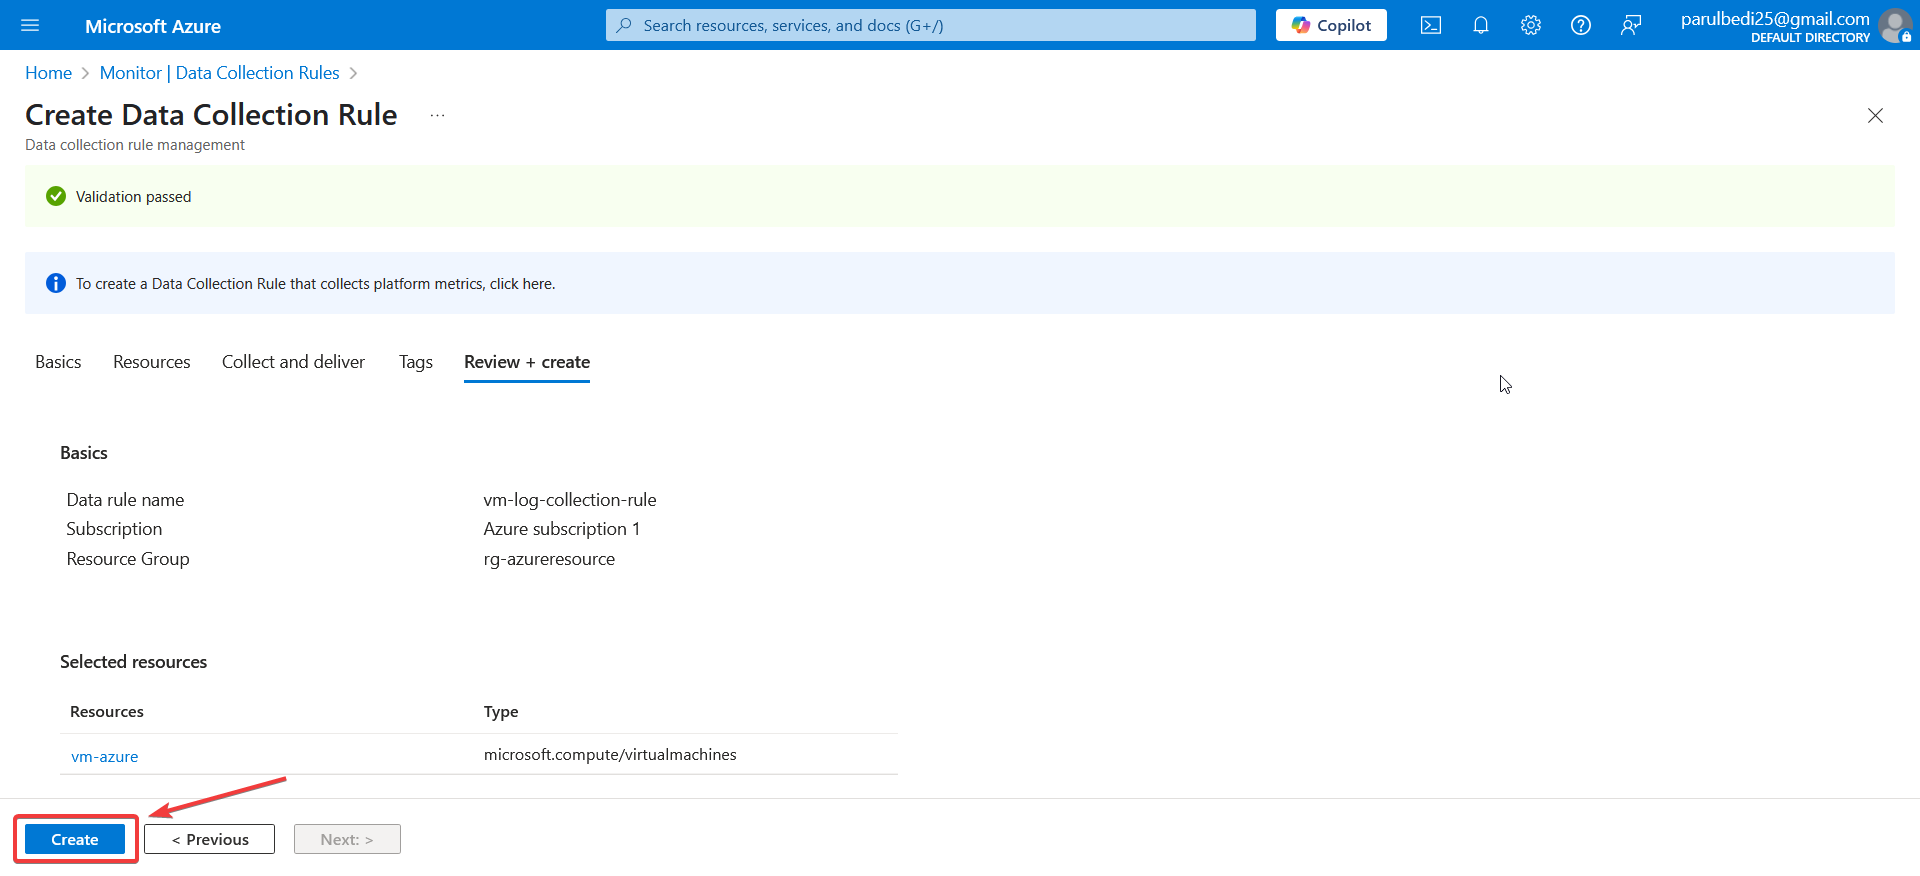
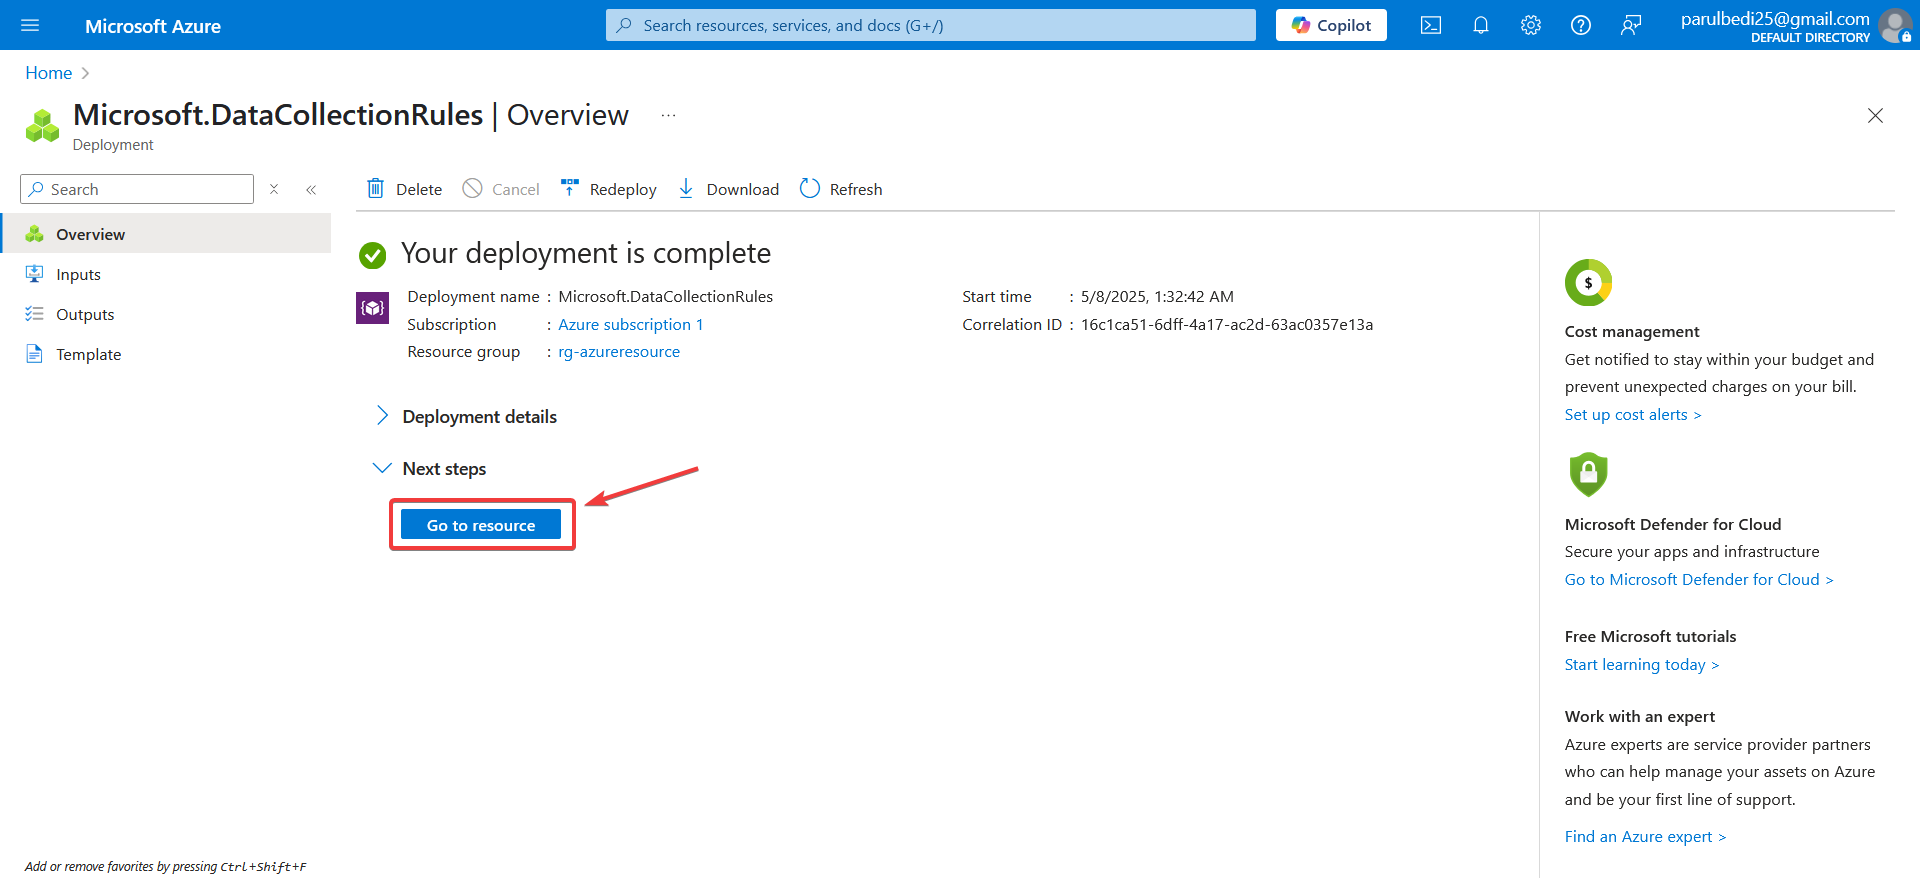
After validation, create the rule and wait for the deployment to complete successfully. Once the deployment is complete Azure displays the deployment confirmation along with a Go to resource button.
9. Open Log Analytics Logs
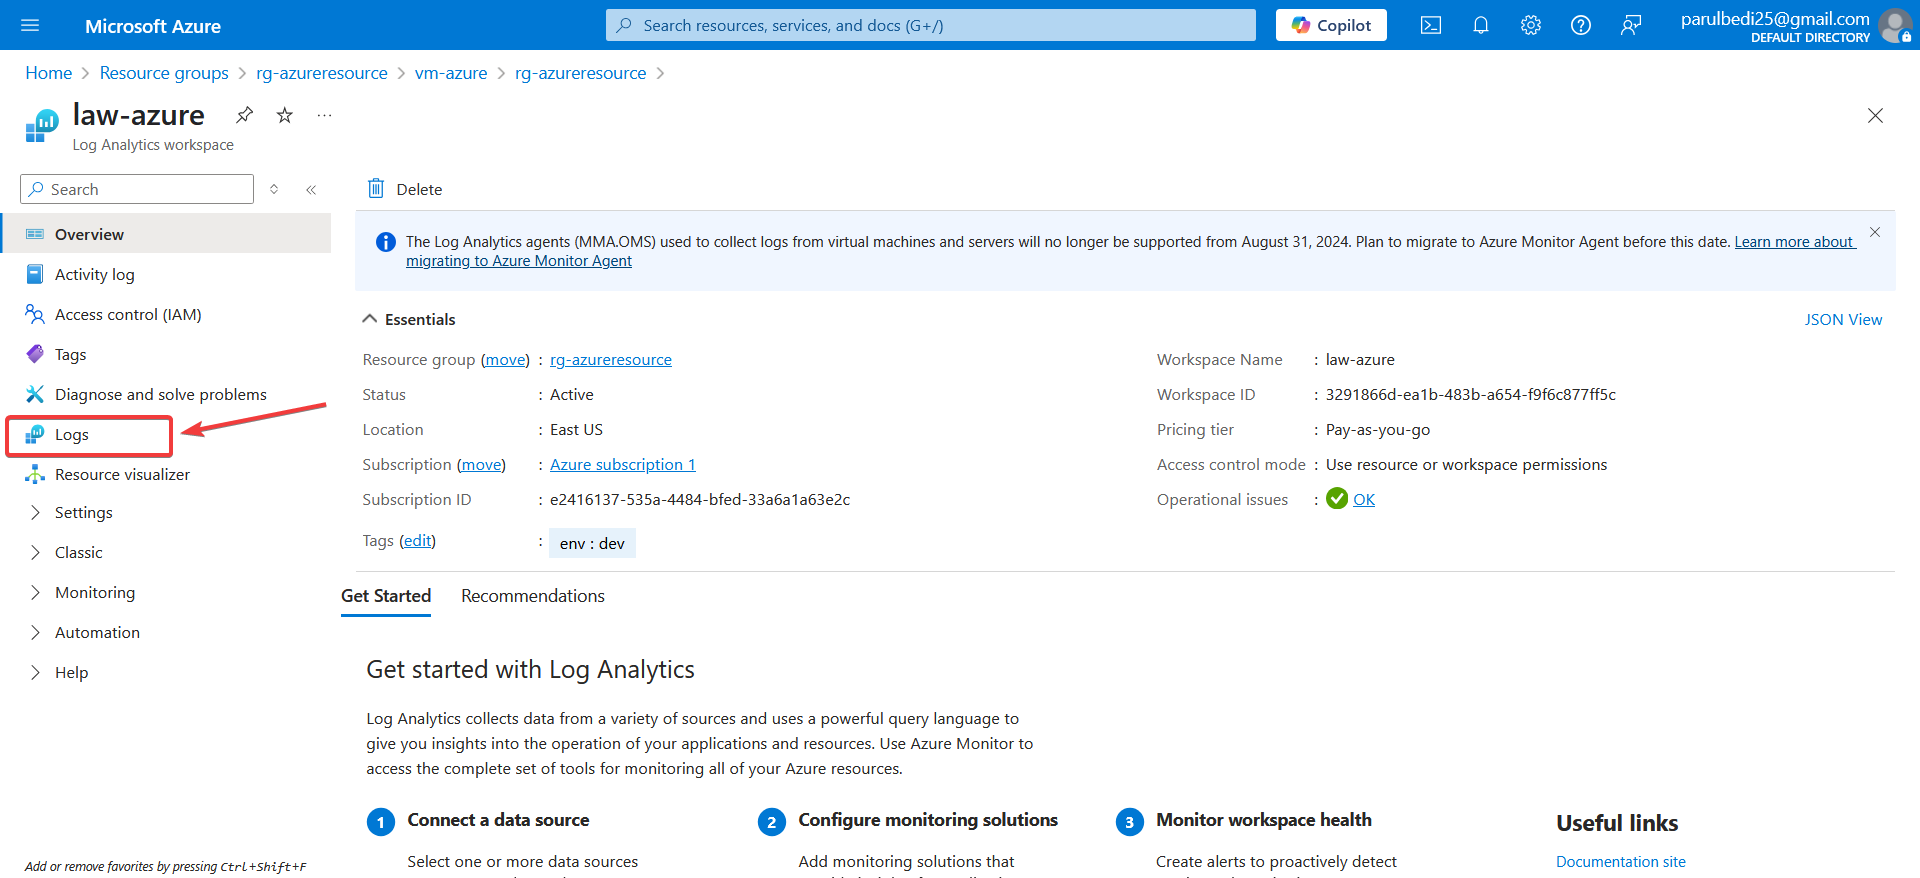
Now comes the most important part to verify the data is actually arriving in Log Analytics Workspace,
Open Log Analytics Workspace → Logs
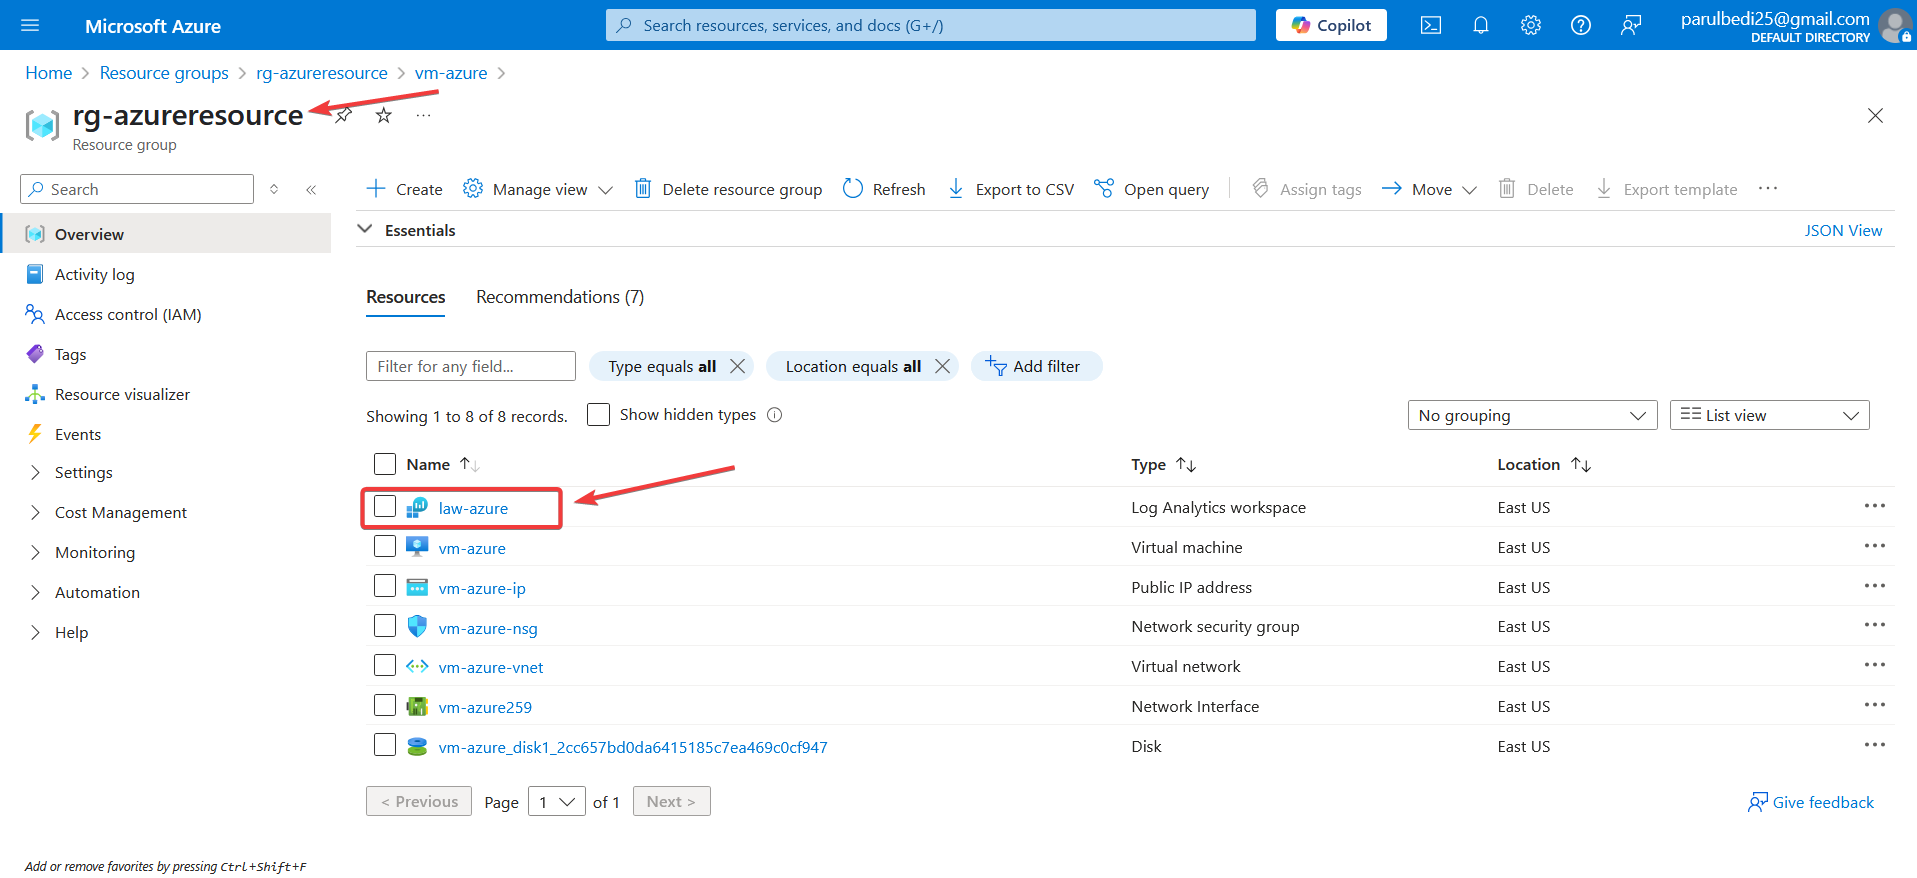
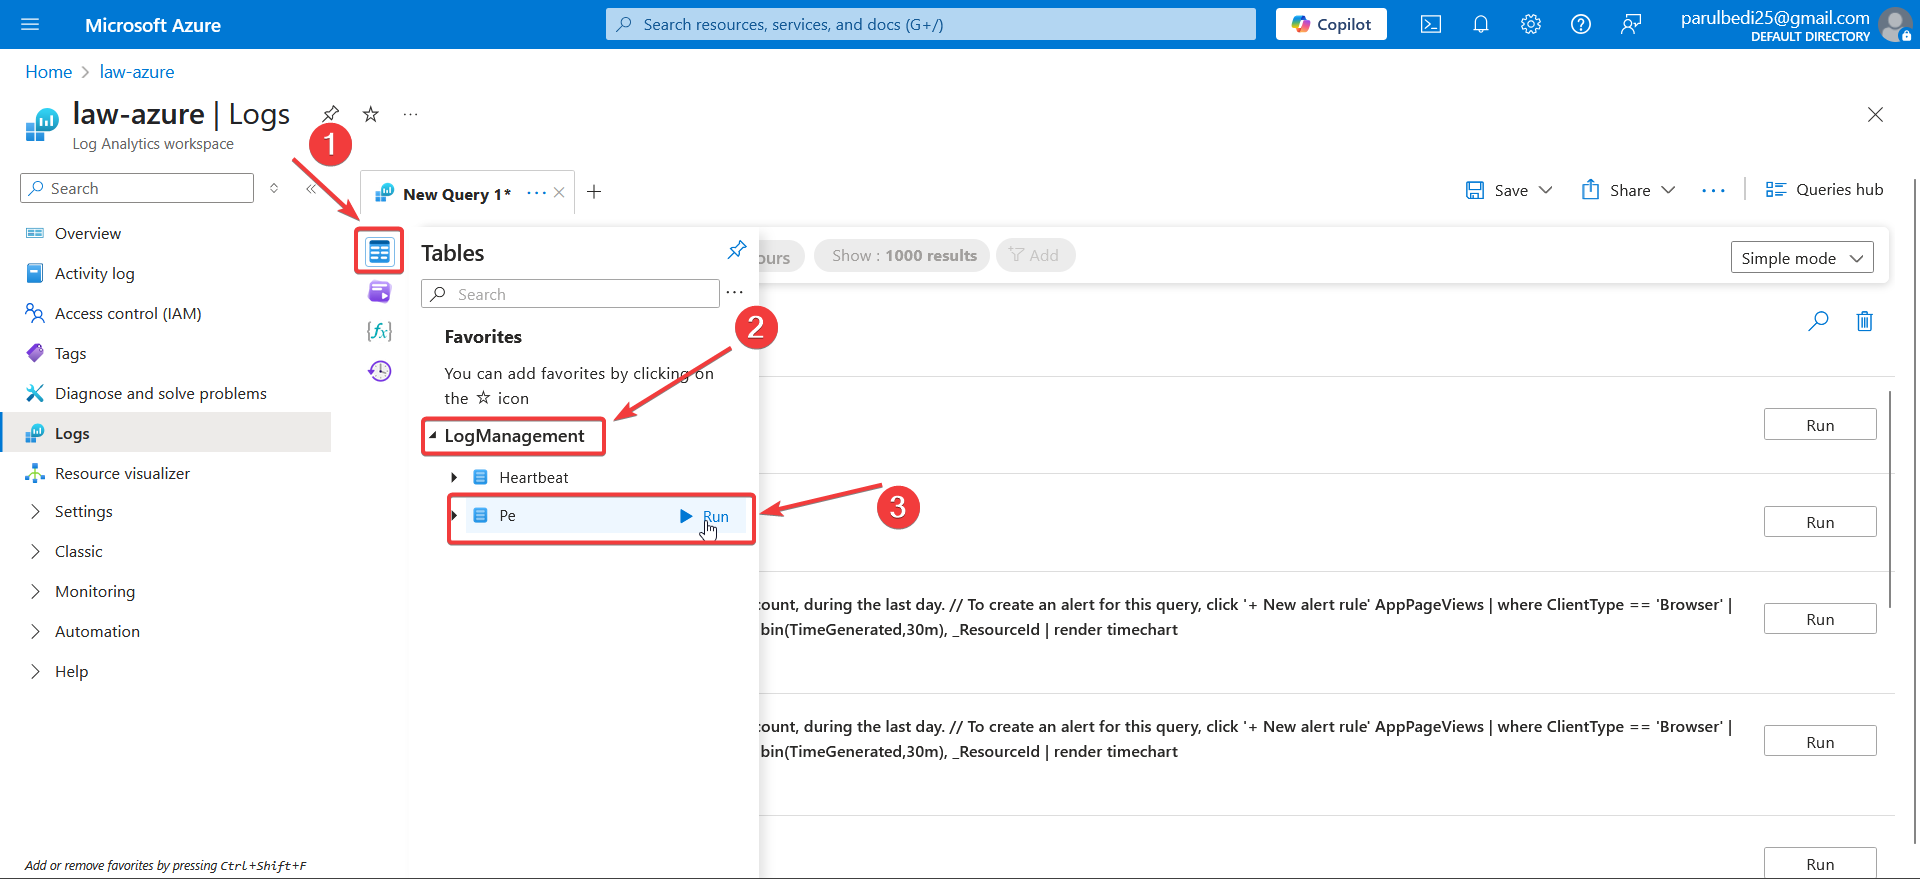
Navigate to the Tables panel within the workspace. Under Log Management, the collected performance data can be accessed and queried. The implementation leverages the performance telemetry generated by the VM for monitoring and analysis
10. Query the Collected VM Data
Once the performance data is available Log Analytics can be used to query and validate the collected telemetry. The query results provide key fields such as TimeGenerated, Computer, ObjectName, CounterName, InstanceName and CounterValue which together identify when the data was collected and the recorded metric value
For example a collected record contain the following values:
Computer: vm-azure
ObjectName: Process
CounterName: Used Memory
InstanceName: nginx
CounterValue: 5226496
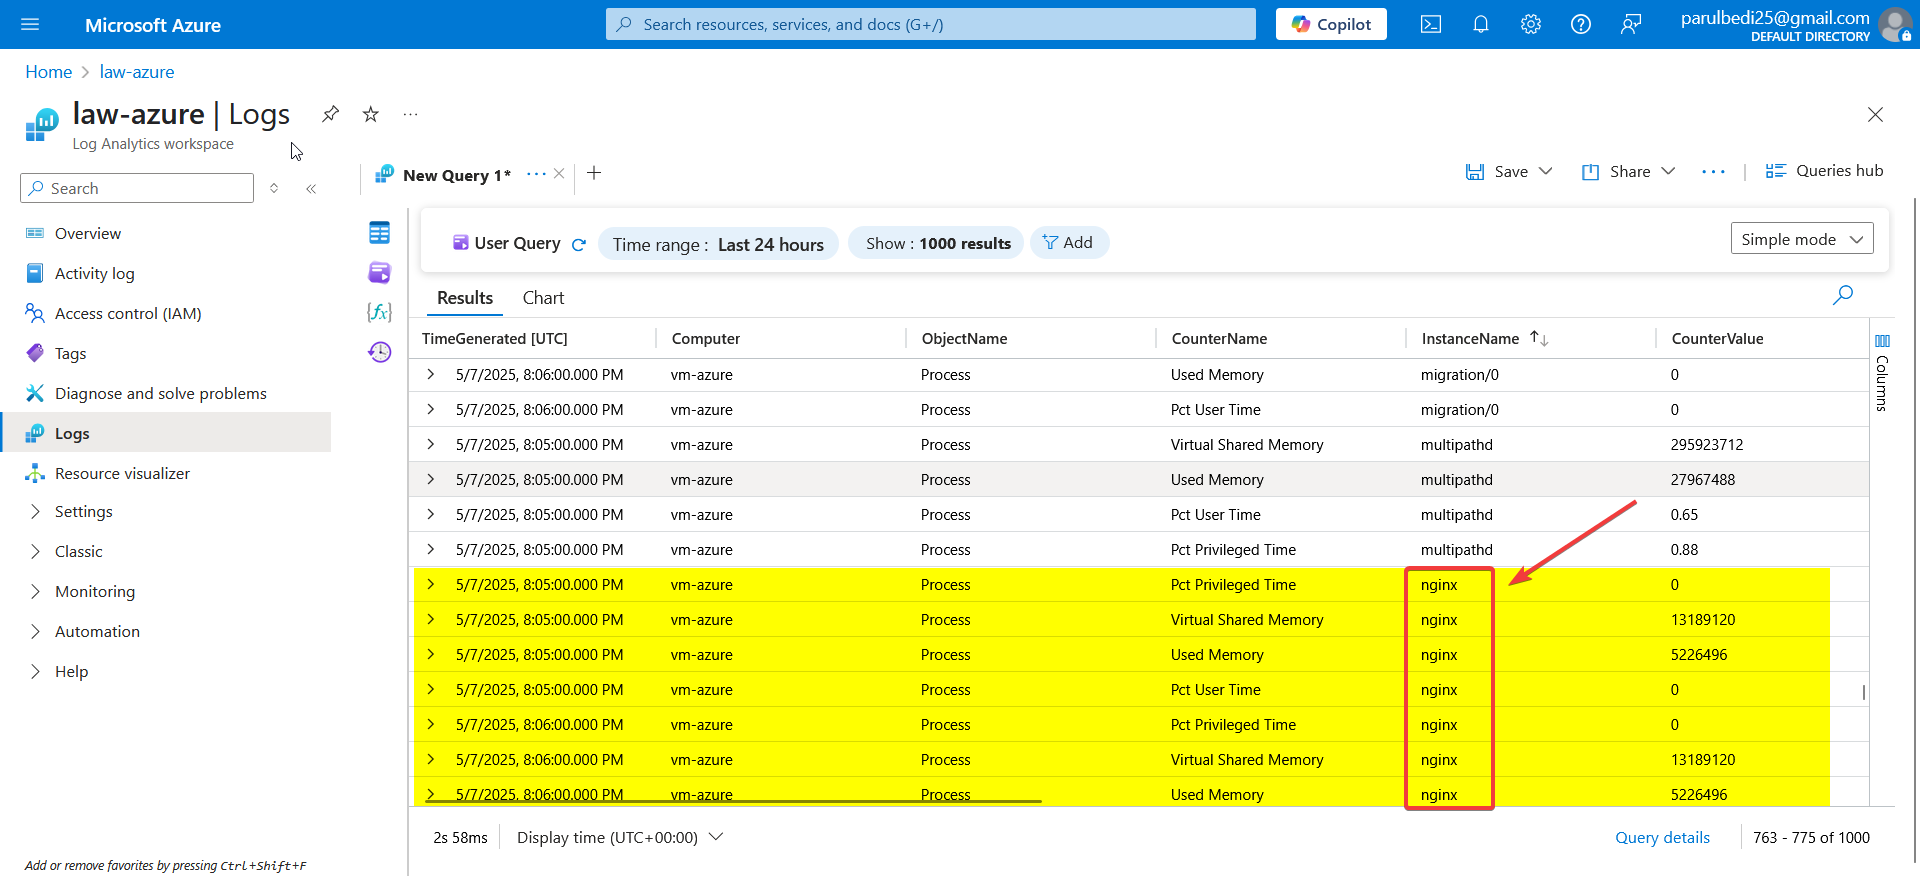
This validation confirms that the monitoring configuration is functioning as expected and that performance telemetry is being successfully collected from the VM and ingested into Log Analytics for further querying and analysis
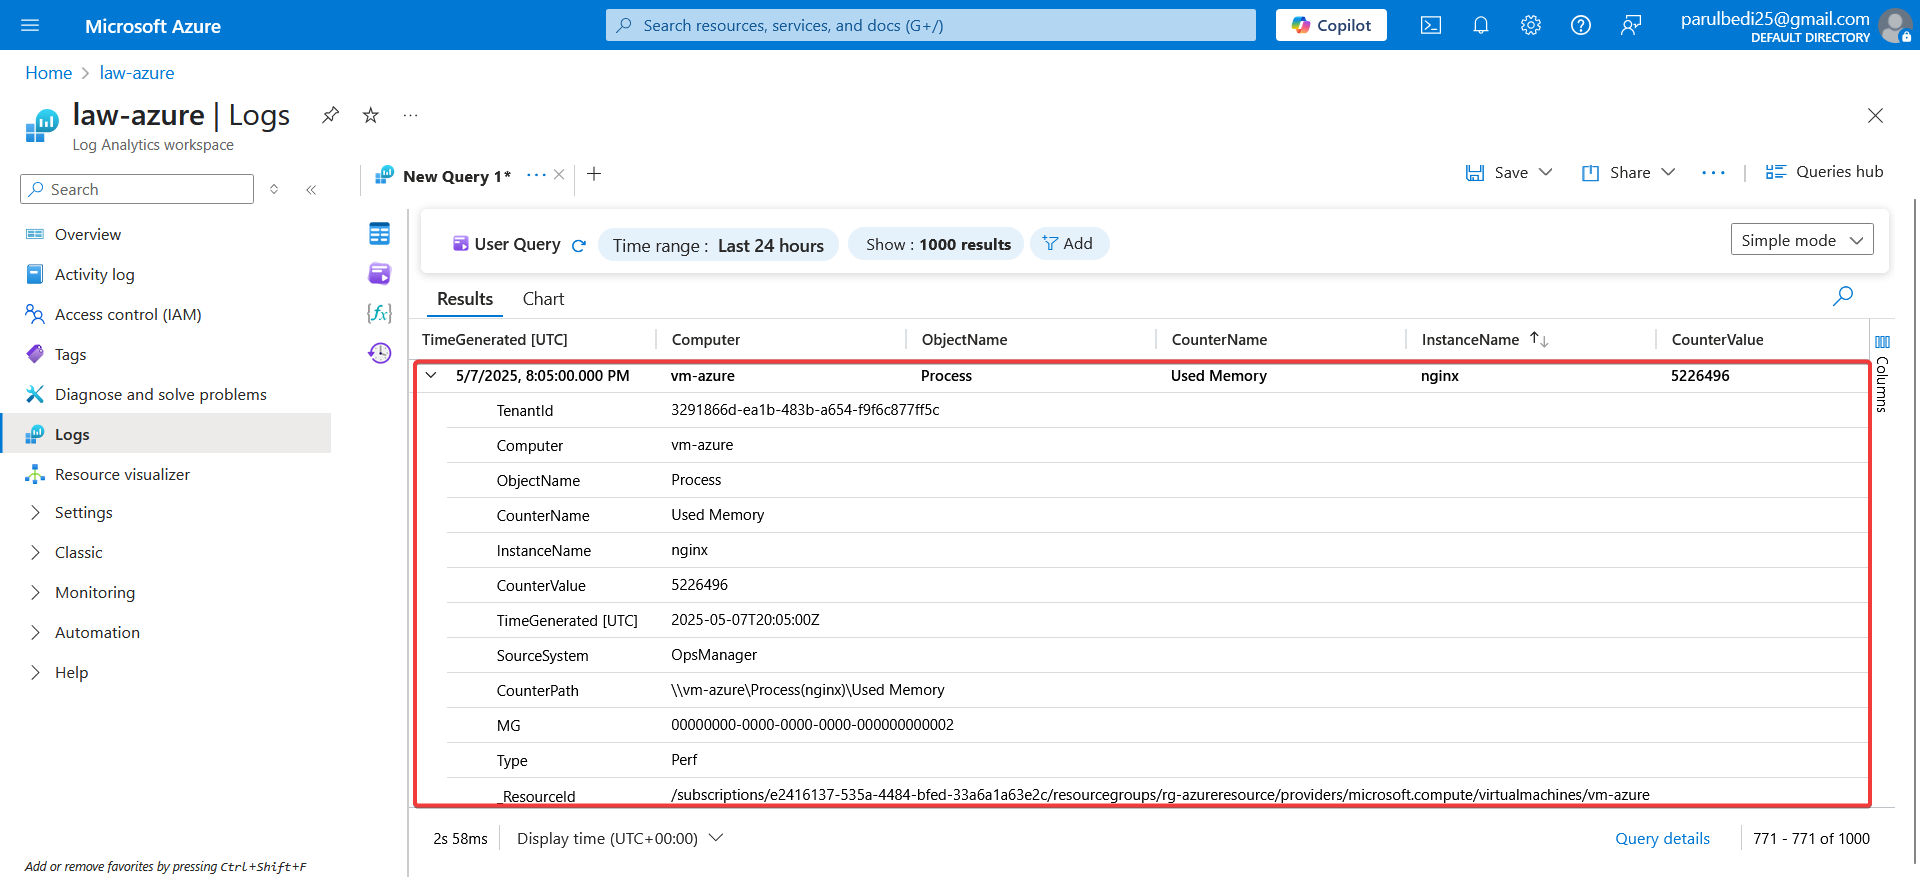
This implementation demonstrates how Azure Monitor can be configured to collect VM performance data and send it to Log Analytics for monitoring and analysis. By configuring the required performance metrics and setting Azure Monitor Logs as the destination and validating the collected data through Log Analytics queries, we can confirm that the VM telemetry is being successfully recorded and is available for further monitoring, troubleshooting and analysis